Testing Both Sides Of The Market
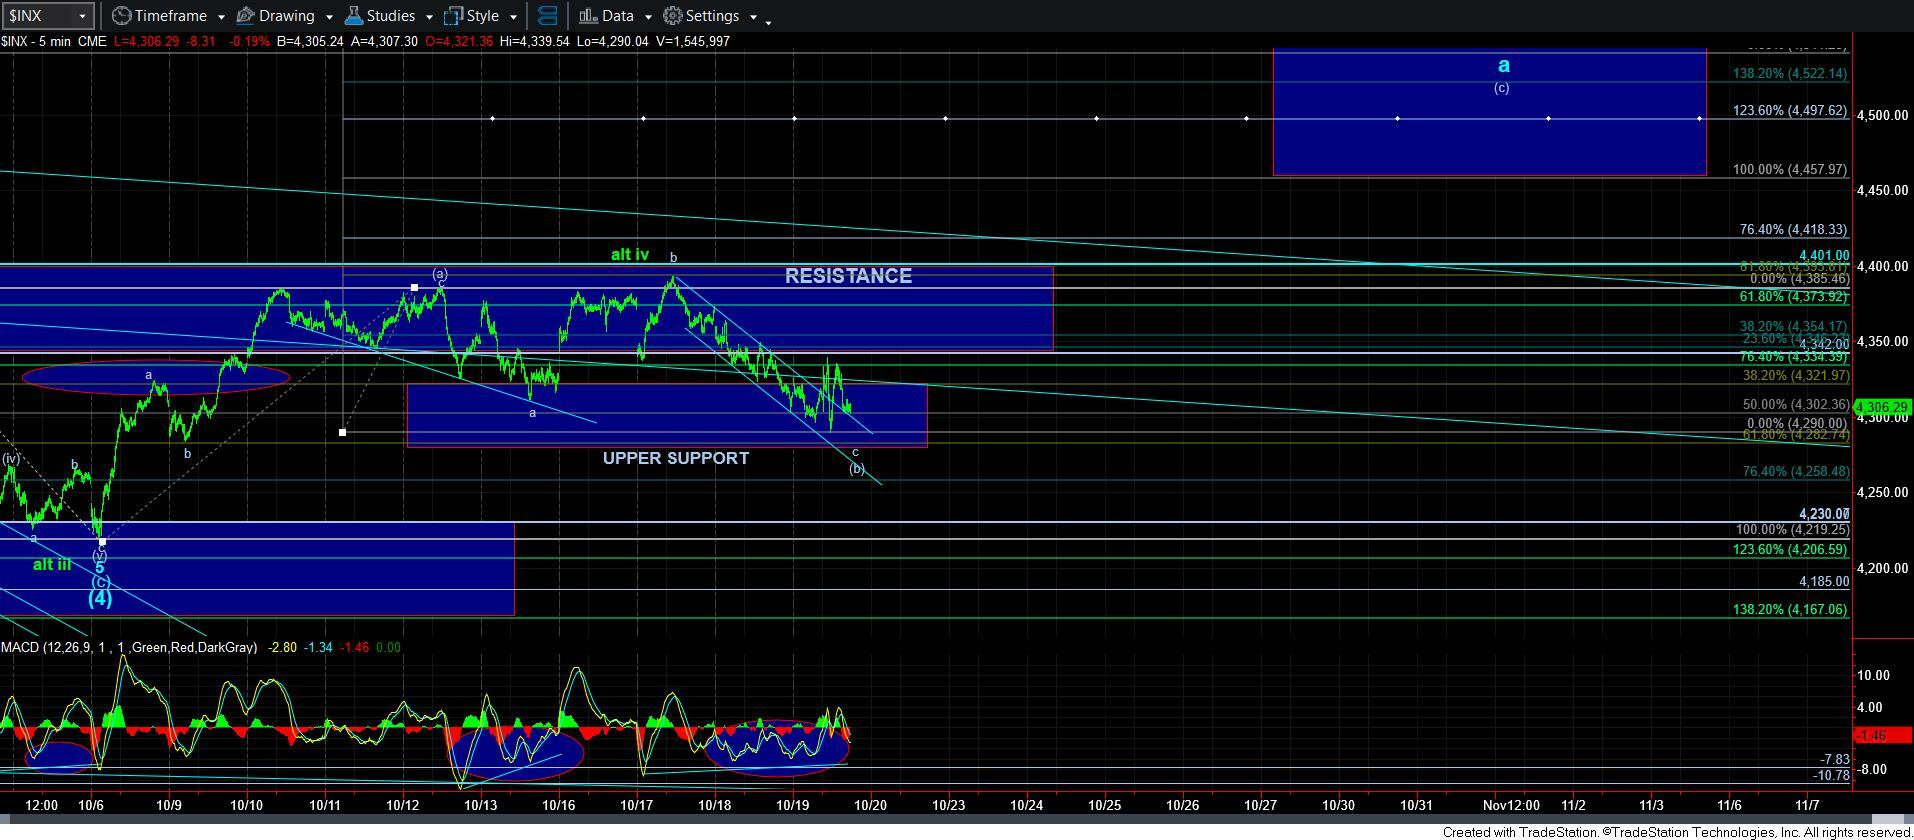
This has really been an amazing last week or two. As we have been noting our resistance region for some time as being the 4375-4401SPX region, the market has tested that region MANY times, and has still not been able to break out.
As you know, on the other side of the market, I have wanted to see us holding the upper support region presented on the 5-mintue SPX chart for a [b] wave pullback, and we have been testing our support as well.
Both sides of the market have been testing each other out, yet a victor has not emerged.
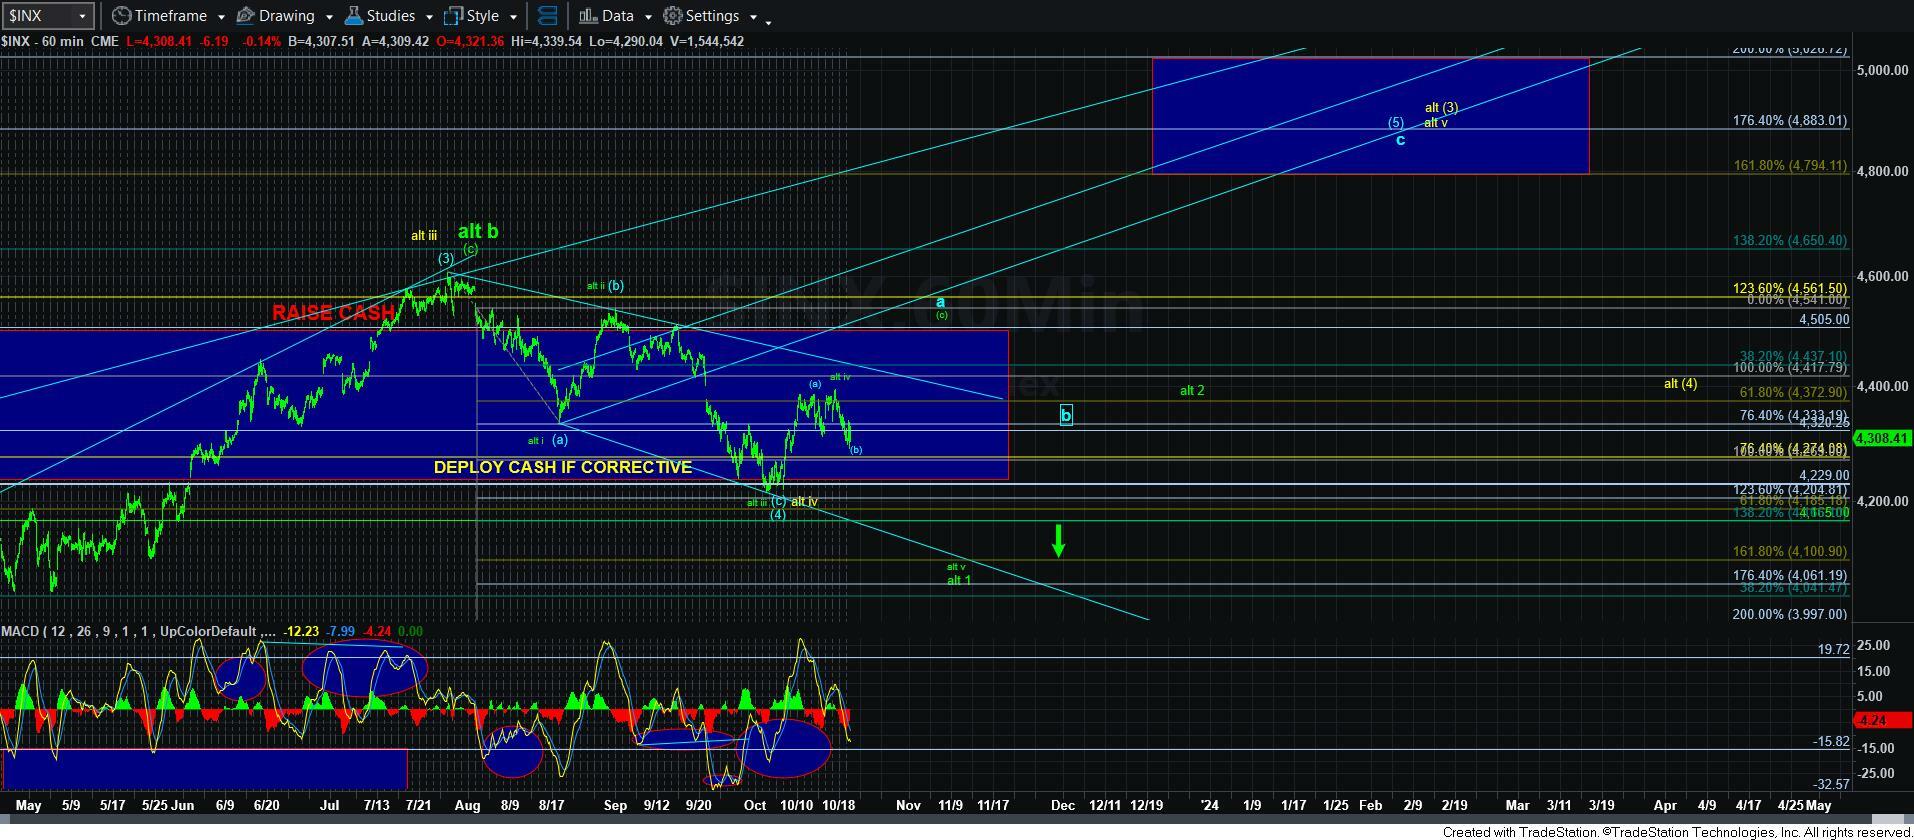
So, I am going to try to keep this simple. As long as we hold over the 4280SPX region, I really do have to look higher in the SPX. Of course, should we see a break down below that upper support region, it does cause me concern regarding the larger degree structure. Yet, as you know, I would need to see a sustained break down below 4165SPX to move into the green count.
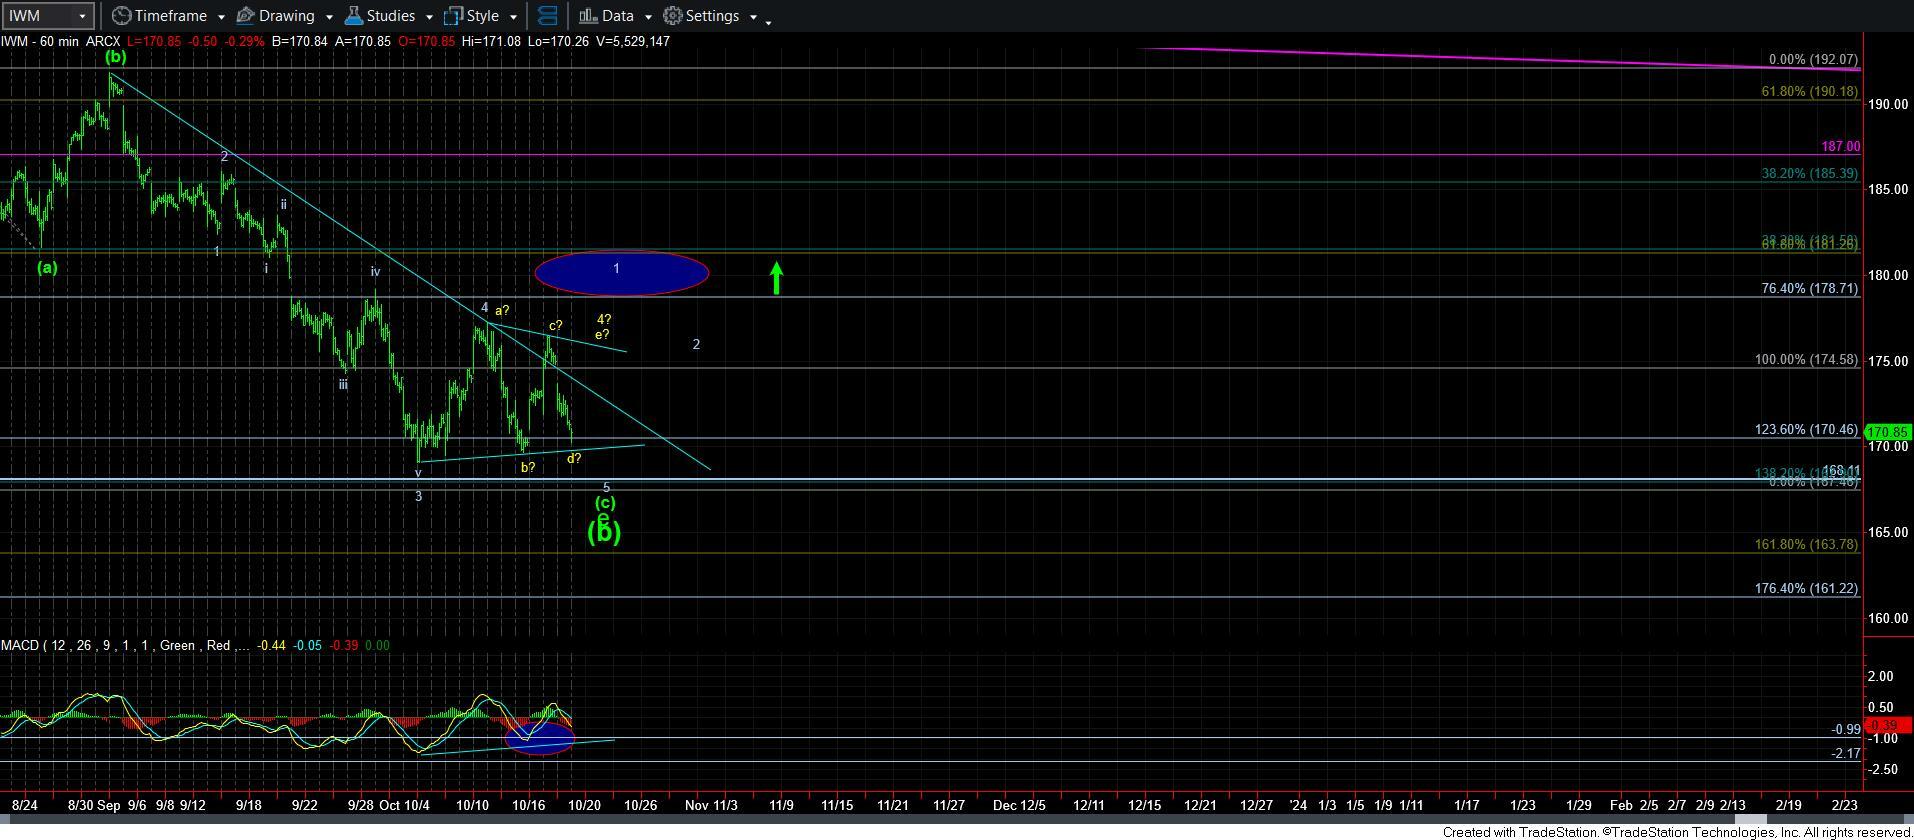
In the meantime, IWM has been whipsawing back and forth, which suggests several things. First, since it had its chance to complete 5 waves up off the low, and failed, I don’t think we have a bottom yet in place. So, I am looking for another test of the lows. Second, should we hold over 169.70, and rally in the coming days, I think the IWM may be tracing out a 4th wave triangle, as I am showing on the 60-minute chart in yellow. But, this does not have to occur, as getting a lower low can be seen in a more direct fashion.
For now, I am still maintaining a bullish bias until the market proves otherwise.