Tested, Yet Again - Market Analysis for Mar 3rd, 2026
I am not sure how many times it will take before a test of the 6720SPX support finally breaks it, but we had yet another today. And, thus far, the market has held yet again.
Moreover, the rally off that low is initially taking shape as a 5-wave structure, which again forces me to place the yellow (b) wave at today’s low, with a reasonable expectation of a (c) wave rally again.
So, while we wait for the market to provide a bit more clarity, I think this is a good time to review our Fibonacci Pinball structure to show how it differentiates between various options.
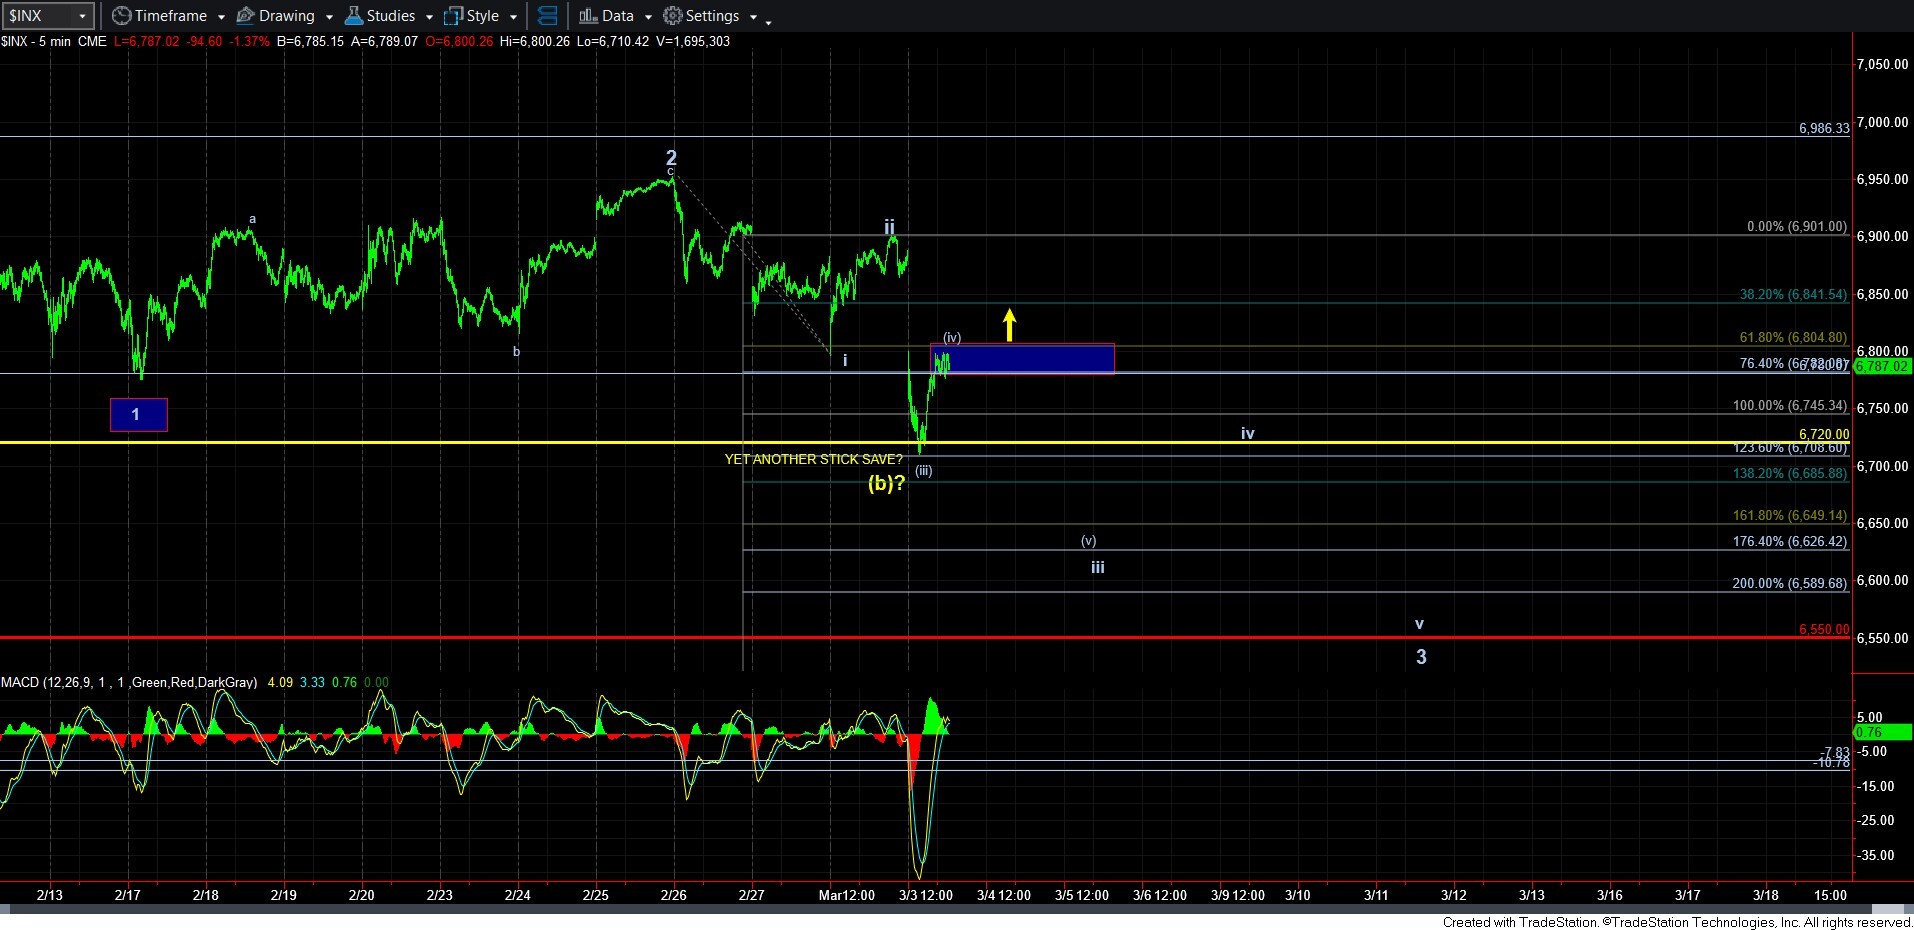
With the market potentially providing us with a 1-2, and a bigger wave i of 3 than standard, the market seemingly was trying to follow through to the downside in a wave iii of 3. So, I set up the Fibonacci Pinball structure with that bigger i-ii structure, which you can see on the 5-minute SPX chart. Normally, wave (iii) of iii will target the 1.236 extension of wave i-ii, and the bounce for wave (iv) of iii usually should not exceed the .764 extension of waves i-ii. But, if we move through the .618 extension, that makes it likely that the downside is not going to follow through in a standard Fibonacci Pinball structure.
Well, we bottomed today at the 1.236 extension of waves i-ii, but we have come back up through the .764 extension and we are testing the .618 extension as I write this update. As a reminder, the .618-.764 extensions of waves i-ii is what I call our “pivot” for this reason.
If the market is going to take out the .618 extension, then it becomes much less likely that we will continue lower in this standard Fibonacci Pinball structure. Moreover, if we do pullback correctively after a 5-wave rally, and then follow through over the high we strike in the initial rally off the low, it puts the yellow (c) wave at new highs back into focus.
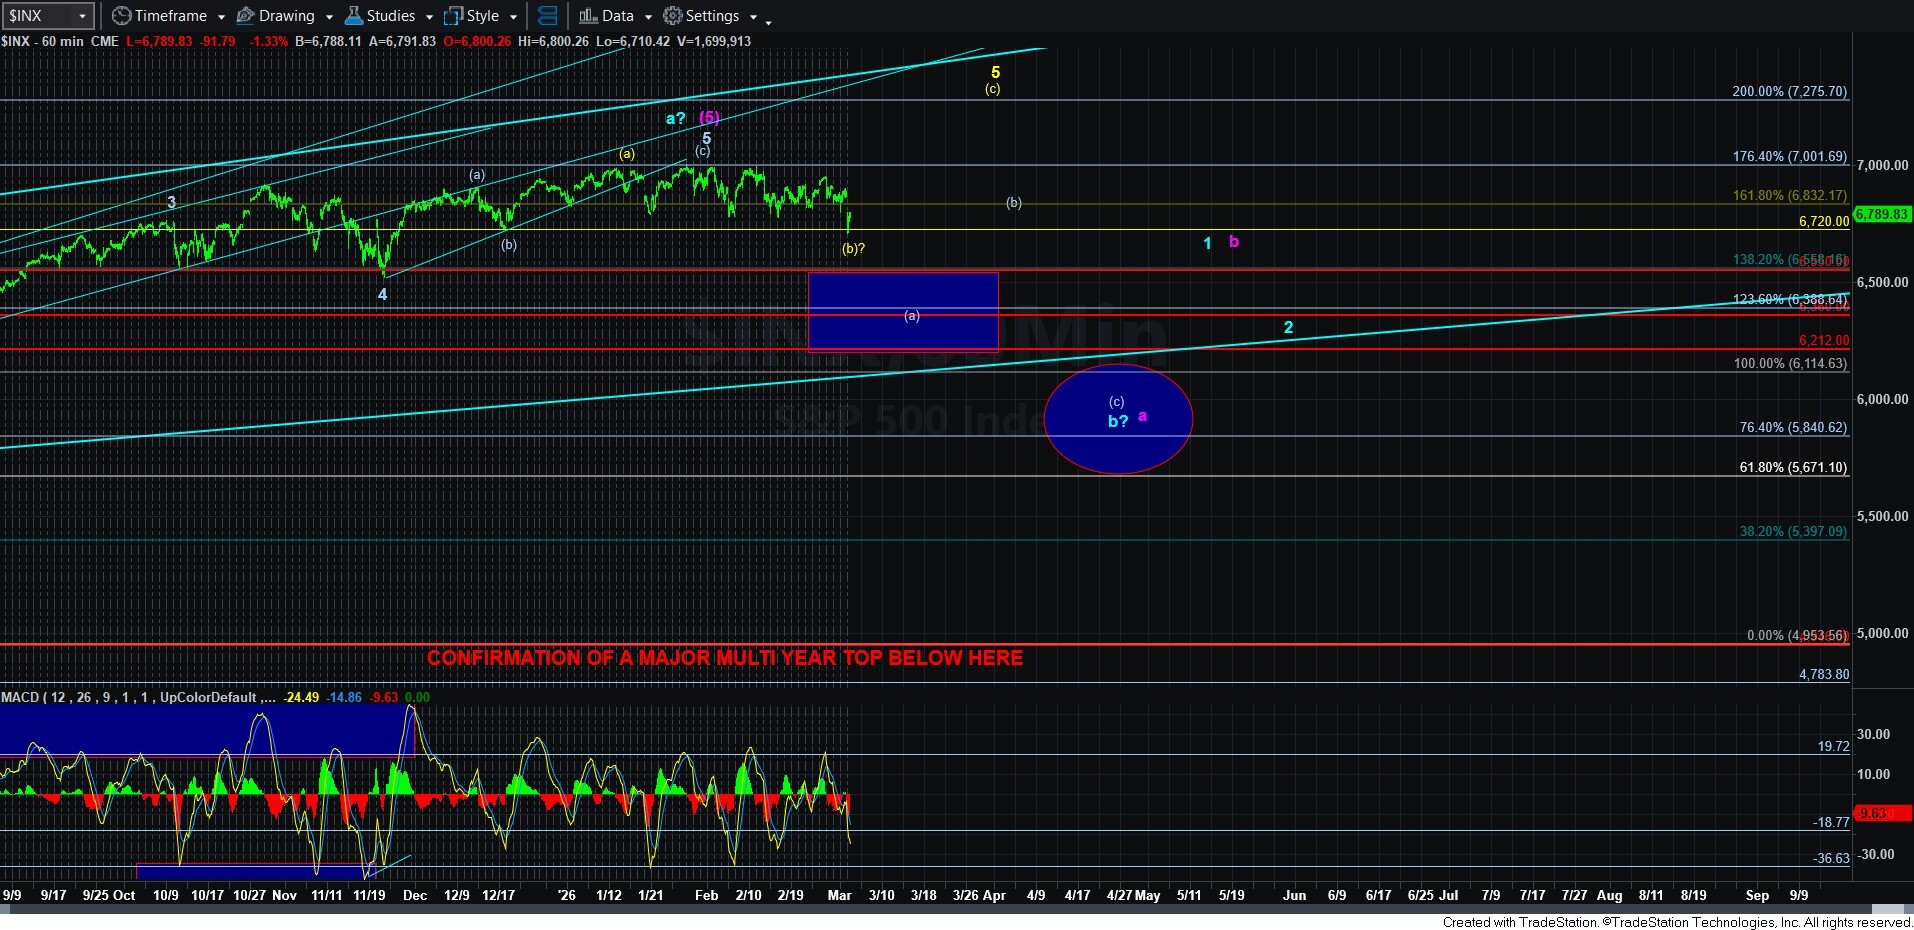
Yet, if the market can break down below today’s low, it can project us down to the 6400-6500SPX region in a 5-wave structure, should it follow through, and complete a c-wave to a larger degree (a) wave, as shown on the 60-minute SPX chart.
As I have said before, this 3-wave action back and forth has certainly not made this region an easy one to navigate. But, I have to assume that it should come to a resolution very soon. But, until we actually fracture that 6720SPX support in convincing fashion, we cannot have confidence that a correction has finally begun.