Taking This One Step At A Time
I don’t like surprises in the market. And, normally, we track two wave counts – one being a primary and the other being an alternative - so that we can avoid surprises. In fact, it is very rare that the market would provide us with a movement which is not covered by one of those two scenarios. And, when you think about being able to limit what can be an infinite number of potential paths in the market down to several options, it tells you that EW analysis provides you with a very powerful tool indeed, even though it can never provide you with certainty. But, then again, nothing can provide you with certainty in the financial markets.
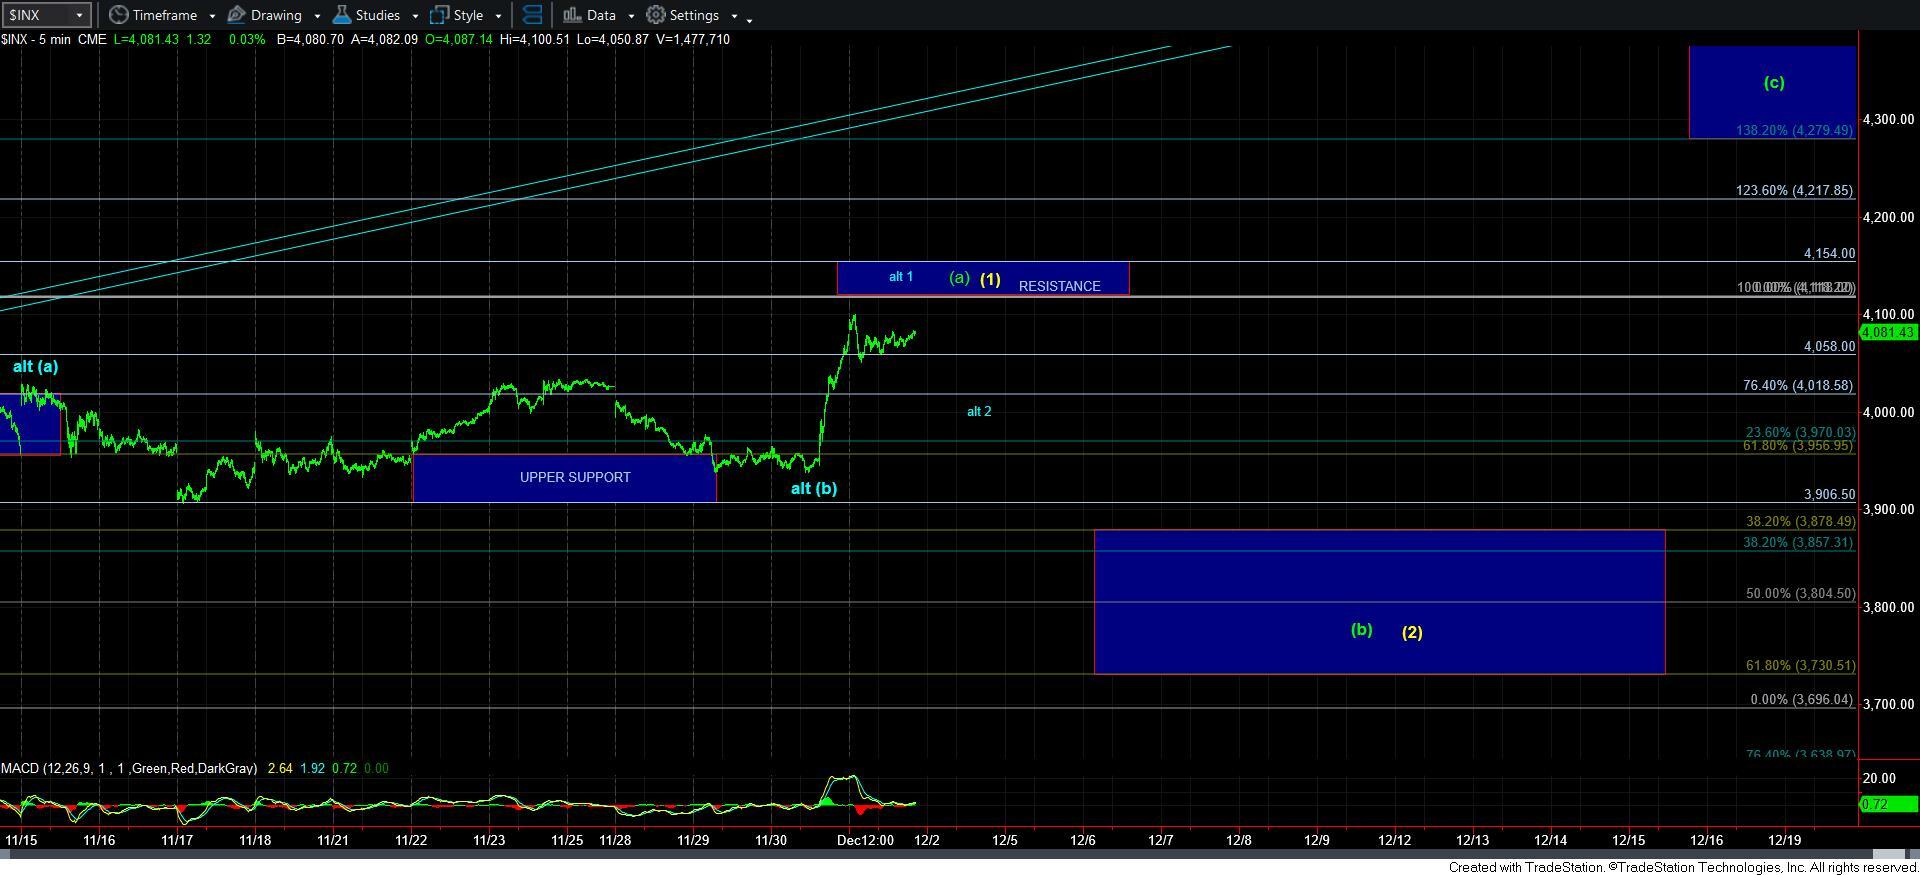
Yesterday, the market provided us with the extension to the [a] wave, which I was tracking as an alternative. But, once we moved through the 4000SPX region, it became clear that the market was going to rally towards the 4118-4154SPX region as our next target.
Today, the market came a bit closer to that resistance/target. And, until we break down below 4058SPX, the market is leaving the door open for one more push higher to that region. However, should we break down below 4058SPX, then we will be tracking two wave counts.
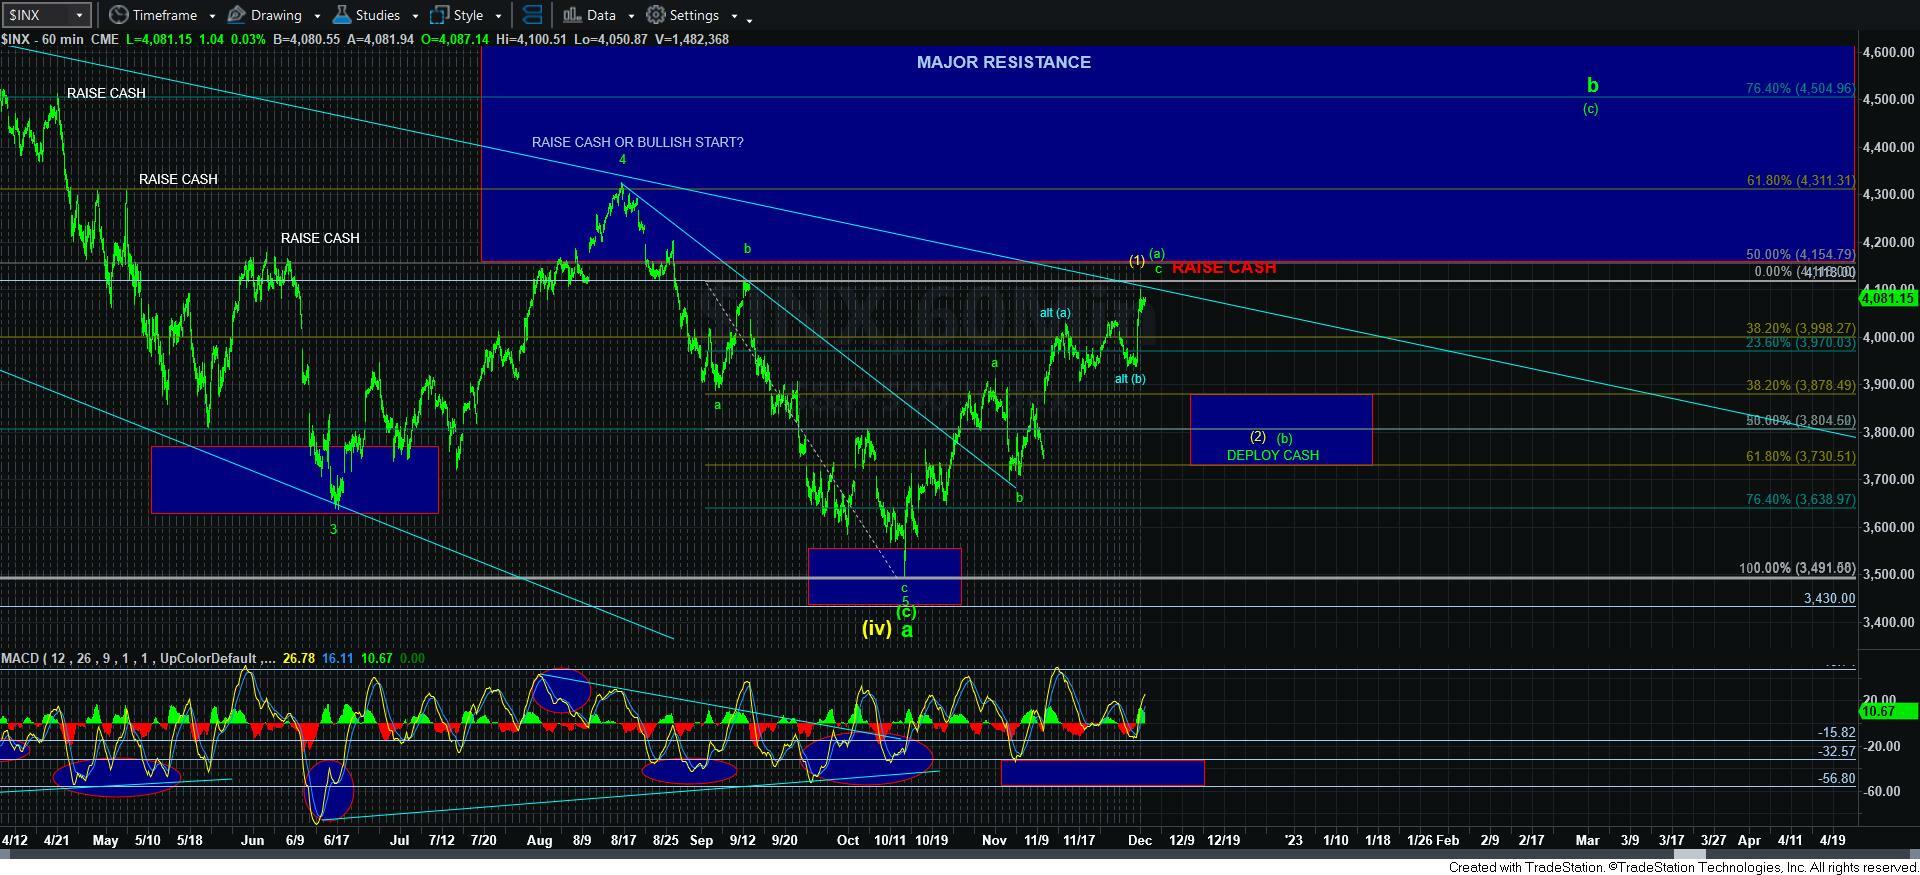
First, I want to note that I consider the green [b] wave and yellow wave [2] as basically one and the same wave count for now, as they both are pointing to the same pattern for at least the next several months. They both point to a larger pullback, followed by a rally to 4300+. I also view this as my primary due to the likelihood we see a bigger pullback due to how extended the MACD on the daily SPX chart has become. But, clearly, we need to break down below 4058SPX to even begin considerations that the bigger pullback has begun.
But, there is an alternative count which is in our way for right now. I have this alternative presented in blue, and noted it yesterday. There is potential that the consolidation we experienced over the last two weeks is the larger [b] wave (as presented in blue), with this rally being wave 1 of the [c] wave. Again, due to how overbought the daily MACD is on the SPX, I do not see this as the higher probability. Yet, I have to know where it can take hold so we are not “surprised.”
So, should the market break down below 4058SPX, and then hold over the 4000SPX region, we could have a 1-2 set up, as presented in blue. Thereafter, a break back out over the high struck in wave 1 (yet to be determined) will turn this into my primary count, and have me looking towards the 4300SPX region sooner rather than later.
In simple terms, we have the 4118-54SPX region overhead as our resistance. Moreover, I think the lower end of that target can strike our top for this rally, assuming it was not already struck. A break down below 4058 will suggest that this rally has peaked. Holding over 4000, and then breaking back out over the wave 1 in blue high will put me into the alternative blue count, which points us to the 4300SPX region sooner rather than later. But, should we break down below 4000, and follow through below yesterday’s low, then we confirm that the green [b] wave or yellow wave [2] is in progress.


