Taking A Step Back
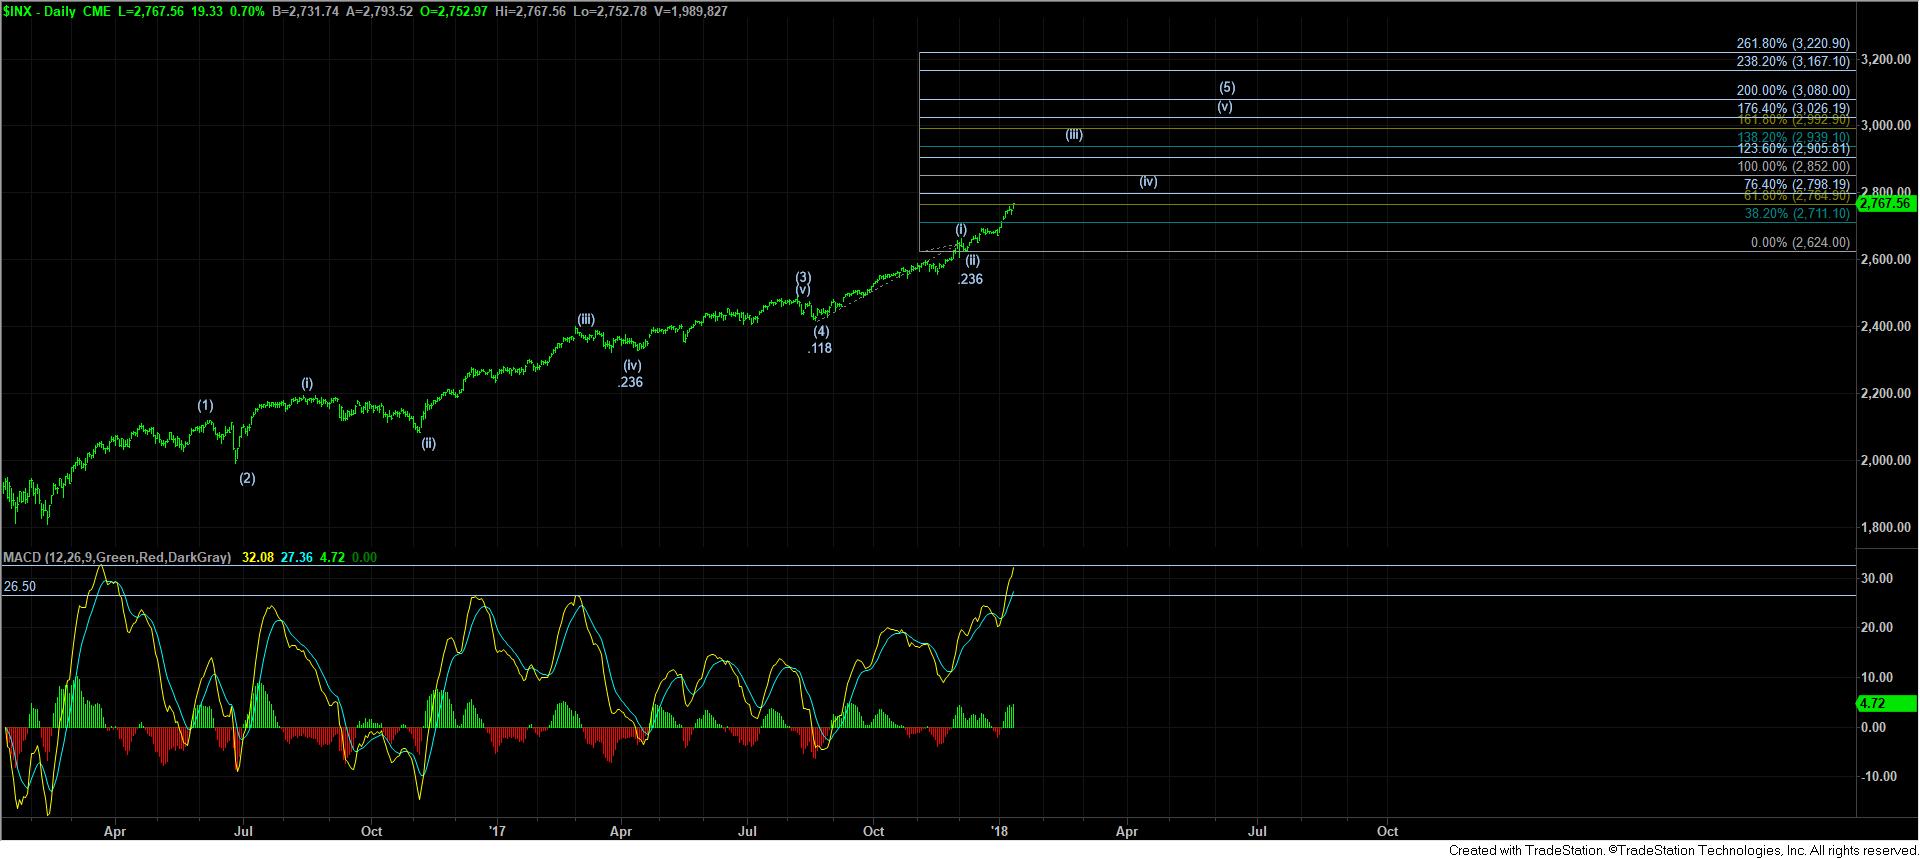
Even though I have actually begun some vacation time with my 8 year old son today (after being ill for the better part of the last 3 weeks), the strength of the action today forced me to spend some time looking at the SPX with fresh eyes. So, I decided to pull up a blank chart from the February 2016 lows, and start from scratch, and see how it would look from the ground up.
Please indulge me as I take us through a bigger time frame perspective on the S&P500 in a cleaner fashion, and try to outline what our overall thinking has been, and why I have a hard time considering the much more bullish alternative of a direct move to 3000SPX, despite the strength we are now seeing. I also want to note that this write up is being done after a late-night hour-long meeting I had with Zac, Garrett, and Mike tonight about these issues.
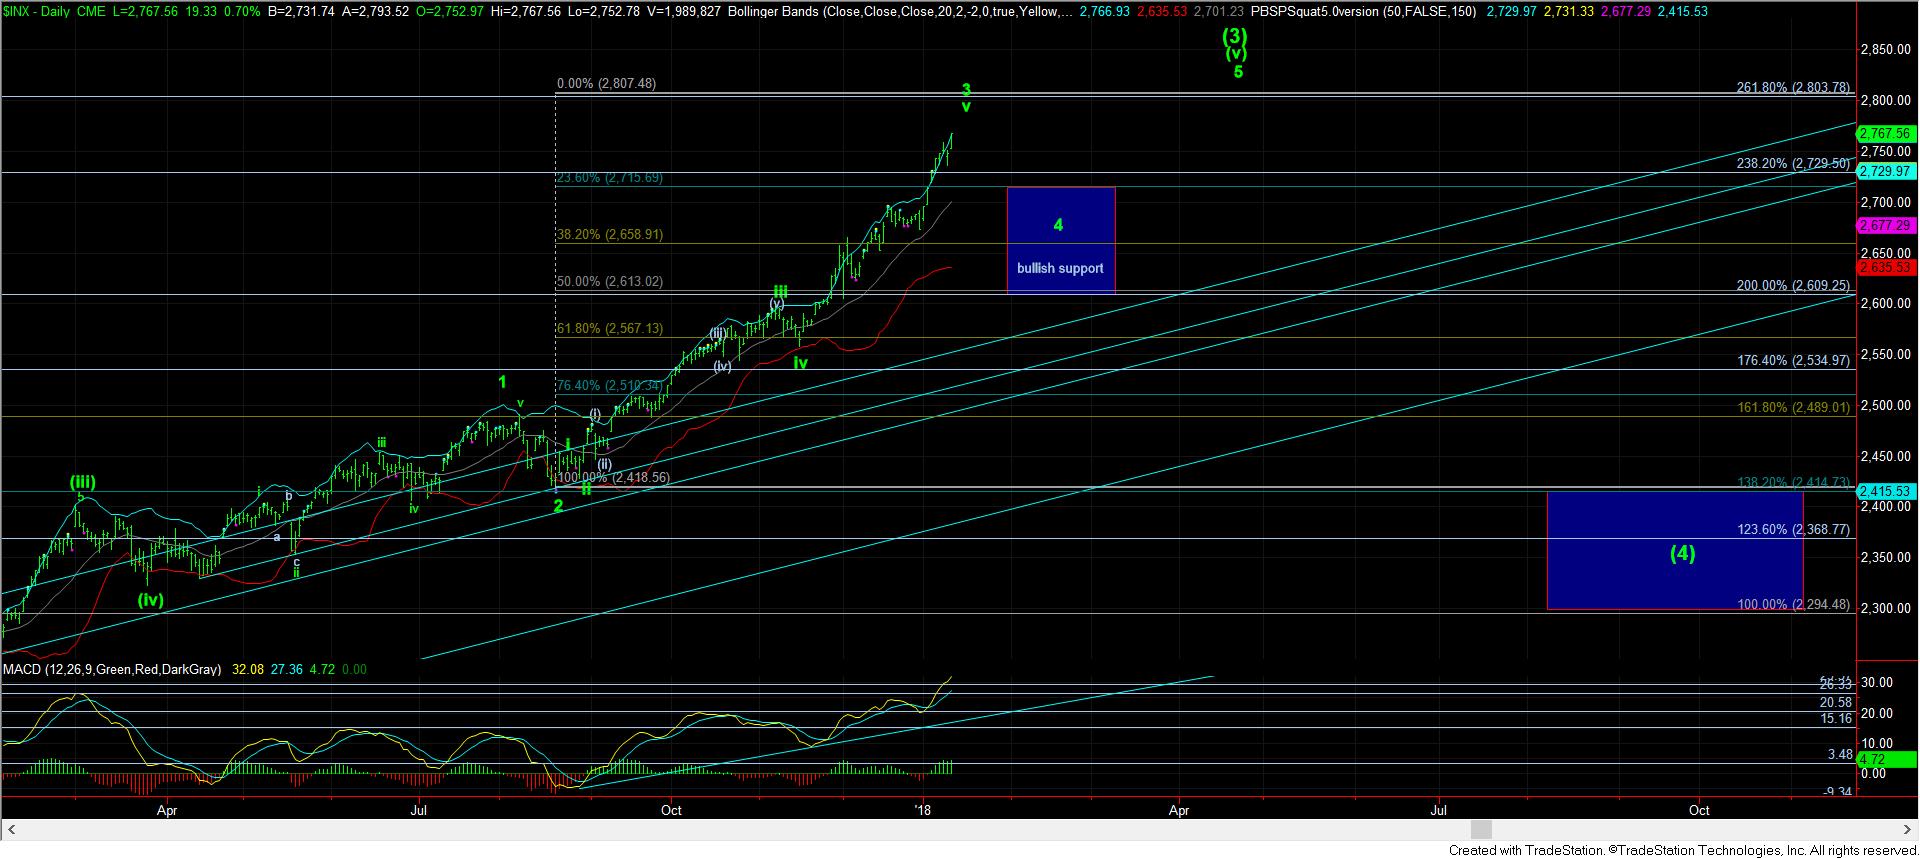
To be honest, my primary expectation right now would be that we should be within days of topping out for wave 3 of (3) on my daily chart, which would align with the XLF chart I have been following. Yet, if this strength continues beyond next week, I may need to consider a pattern that is what I would normally consider a highly unlikely pattern in the equity market if you would describe it to me in detail the way I am about to describe it to you. So, please understand that this is not something I am now adopting, despite how strong the market seems to be right now. Yet, I want to address the rarity of this potential pattern, which is why it is hard for me to adopt unless forced to do so.
Let’s start off the February 2016 lows. For those that remember, we were looking for the market to bottom out and begin a larger degree rally that would likely take us 40%+ higher in the coming years. We certainly attained that target.
And, as the market approached the lower end of the target we set two years ago, it provided us with a pullback in August and September of 2017, as we had expected. Up until this point, the market was acting in a very typical fashion regarding expectations for almost two years.
But, the pullback we experienced at that time came up short of our ideal target as well as the size of what one would expect for a wave (4), which made me believe that it could not be wave (4). If you look at the clean SPX daily chart I presented tonight, if you adopt that pullback as wave (4), you would have to view that wave (4) off the 2016 lows as only attaining a .118 retracement of wave (3), which is not something I have seen in the equity markets. Remember, the standard retracements for a wave (4) target the .382 retracement of wave (3), with a minority holding support at the .236 retracement. So, again, a .118 retracement is simply not seen within any realm of relative probabilities.
Moreover, if you are going to adopt the perspective that we are heading directly to the 3000 region over the next 6 months, you would then have to adopt another (i)(ii) structure which provides only a .236 retracement for wave (ii), which is even an unusual retracement for a 4th wave, much the less one for a 2nd wave (as 2nd waves normally retrace .500-.618 their 1st wave structure). And, again, this is coming off a .118 retracement for the prior wave (4). This is why I have been noting that this action has been a statistical anomaly and outlier as to what is normally seen. It does not invalidate the Elliott Wave structures or make them any less reliable in the great majority of times, as some may feel. But, it certainly suggests that we are well outside of the standards which are normally seen in the ratios within those structures.
Again, to adopt an expectation that we go directly to the 3000 region from here would mean that we would adopt pullback ratio’s which I have not seen in an equity market. To say that the probabilities for such potential would be low would be an understatement, at least in my humble opinion. Of course, the market can do what it wishes, but that does not mean I can adopt what I would view as a low probability potential as my primary expectation.
Rather, what I have done, and will continue to do, is caution against shorting a bull market, and recognizing that the market has not entered its larger degree 4th wave until support breaks. And, as the market has continued higher, clearly, I have moved support up along with price so that we will maintain an accurate breakdown point to suggest a larger degree 4th wave is in progress. But, until the time of such break, I have strongly warned, and will continue to strongly warn, against aggressively shorting a bull market.
Moreover, as part of our meeting tonight, Garrett and Zac worked with me in aligning the major stocks in the overall equity market with where we now reside, as well as Mike aligning the counts with what he is seeing in the volatility products he tracks. That deeper analysis also supports that we are simply in an extended wave (3), as presented on the SPX daily chart.
Clearly, my hand would be forced if we were to see a continued move through the 2850SPX region before the end of January, without seeing a deeper retrace back to the 2650-2700SPX region, as presented in the primary on my daily chart. But, as it stands right now, this cannot be my primary expectation for the reasons set forth above.
I do understand the frustration some may feel if they turned more conservative once we began to exceed the targets we set two years ago for this rally. But, please also realize that we have been trying to urge - in as strongly worded and constant updates as possible - that one should never short a 3rd wave rally until some support is clearly broken which would suggest that the 3rd wave has completed.
In fact, even though some may view this as a weakness of Elliott Wave, if you understand how to use it in its most useful manner, you would understand that it provides targets for potential turns (not definitive ones), and also calculates the support levels which must be broken to confirm that a turn has occurred, at least from a higher probability perspective.
However, one must also understand that a prudent investor must approach the markets based upon probabilities and standards as to what is normally seen in those equity markets, rather than with reckless abandon in expectations of outlier and what would normally be a lower probability scenario (at least as we outlined them two years ago).