Taking A Step Back
As I noted earlier today, I think this is a good time to take a step back, and look at the forest, as we have been focusing on the leaves quite a bit of late.
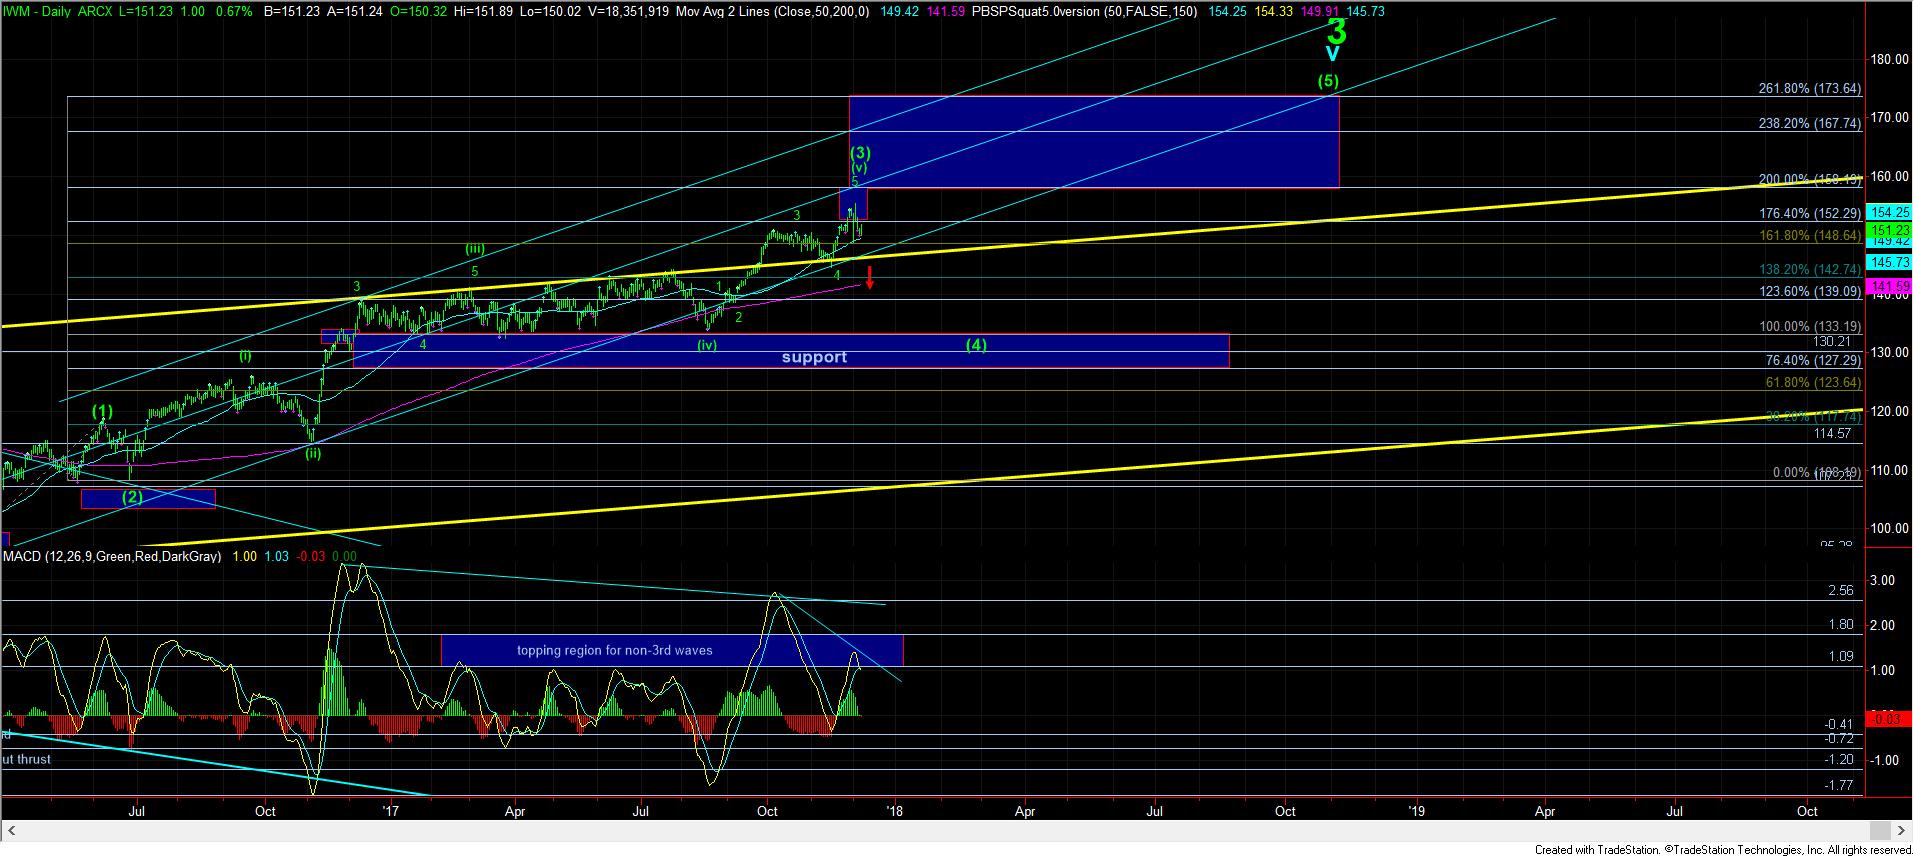
Back in early to mid-November, I had strongly reiterated that I cannot consider that the equity market has topped until we see a completed 5th wave up in the IWM. And, so, with the pullback just below the 145 region in the IWM, I went long for a trade, while looking towards the 152-156 region. To date, we have hit our target, with the high, thus far, being struck at the 155.41 level.
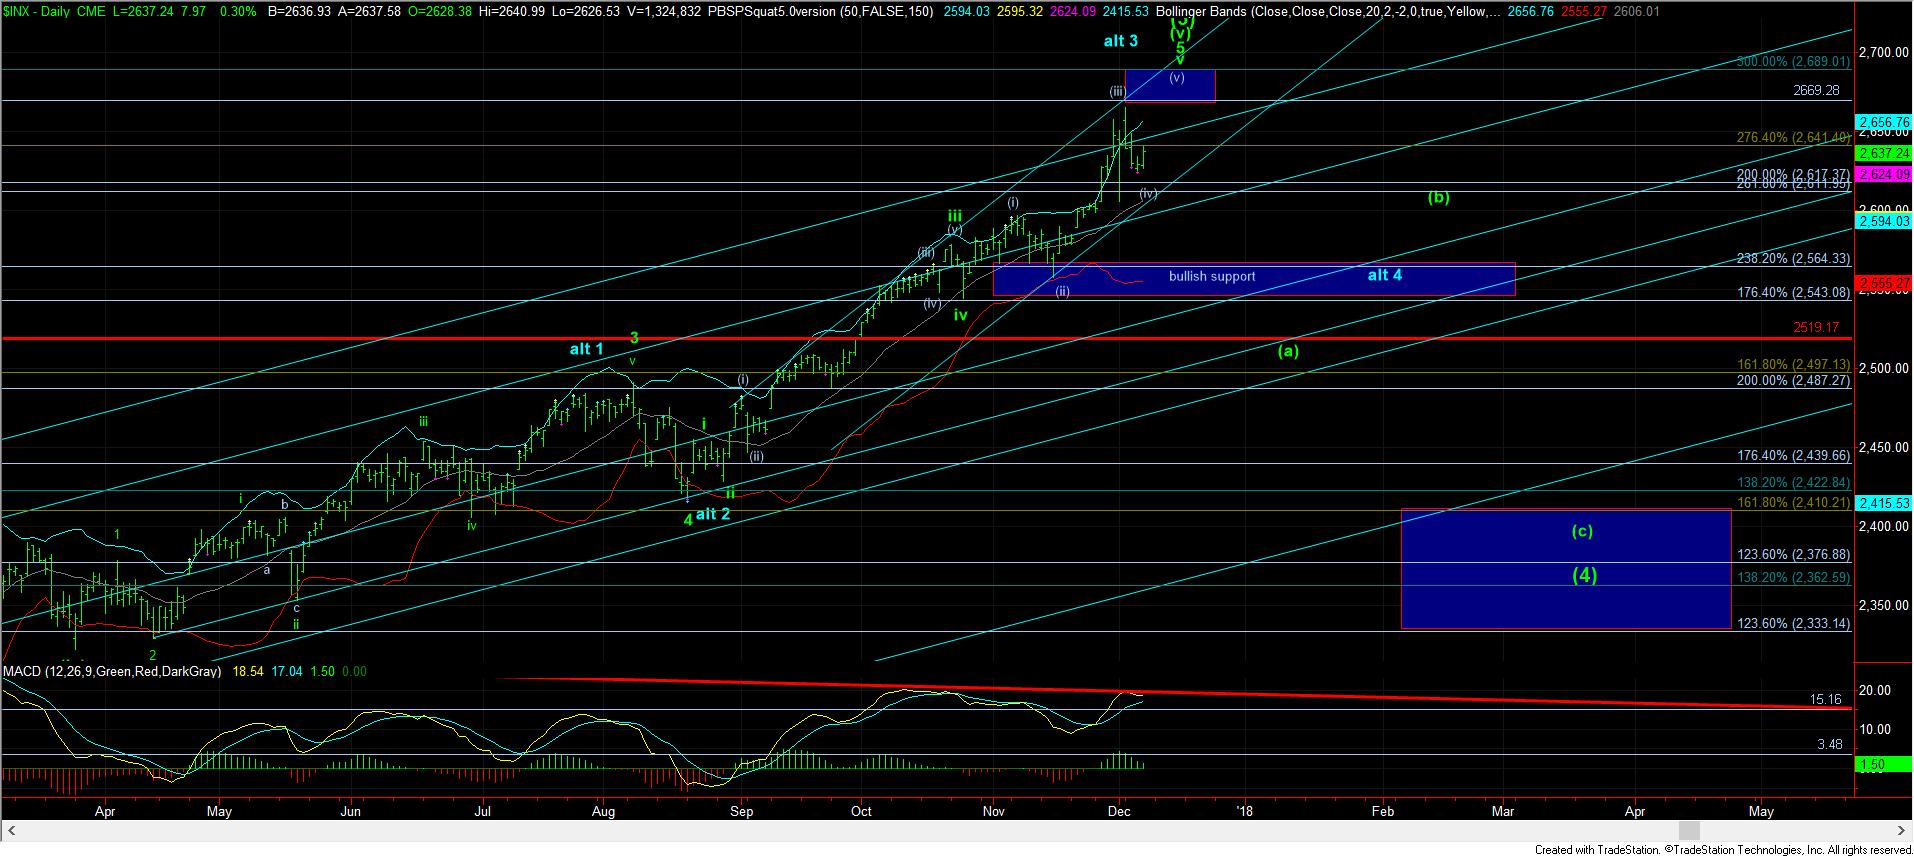
Therefore, if we take a step back, we must recognize the potential that we are close to completing (or have indeed completed) the 5 waves we expected in mid-November. Such a completed 5 wave structure would complete the entire wave (3) off the February 2016 lows, and suggests we should be on the lookout for a larger degree wave (4) in the coming months. That 4th wave is pointing us towards the 2400 region in SPX, and the 133 region in the IWM.
Additionally, if you take a look at the daily chart of the IWM, and notice the MACD, it has provided us with textbook indications supporting our Elliott Wave count. The wave 3 of (iii) clearly showed the most strength, whereas the wave 4 of (v) showed the first negative divergences of relative 3rd waves. That is textbook indications of us being in a 5th wave in wave (3). Moreover, we are now seeing even further divergences on the daily MACD, which supports our perspective that we are LIKELY completing the 5th wave of wave (v) of (3). So, yes, the technical indicators are supporting our general wave count on the larger degree. While it does not mean that we have certainly topping in the micro structure up here, it is supporting the bigger perspective we present on the daily chart.
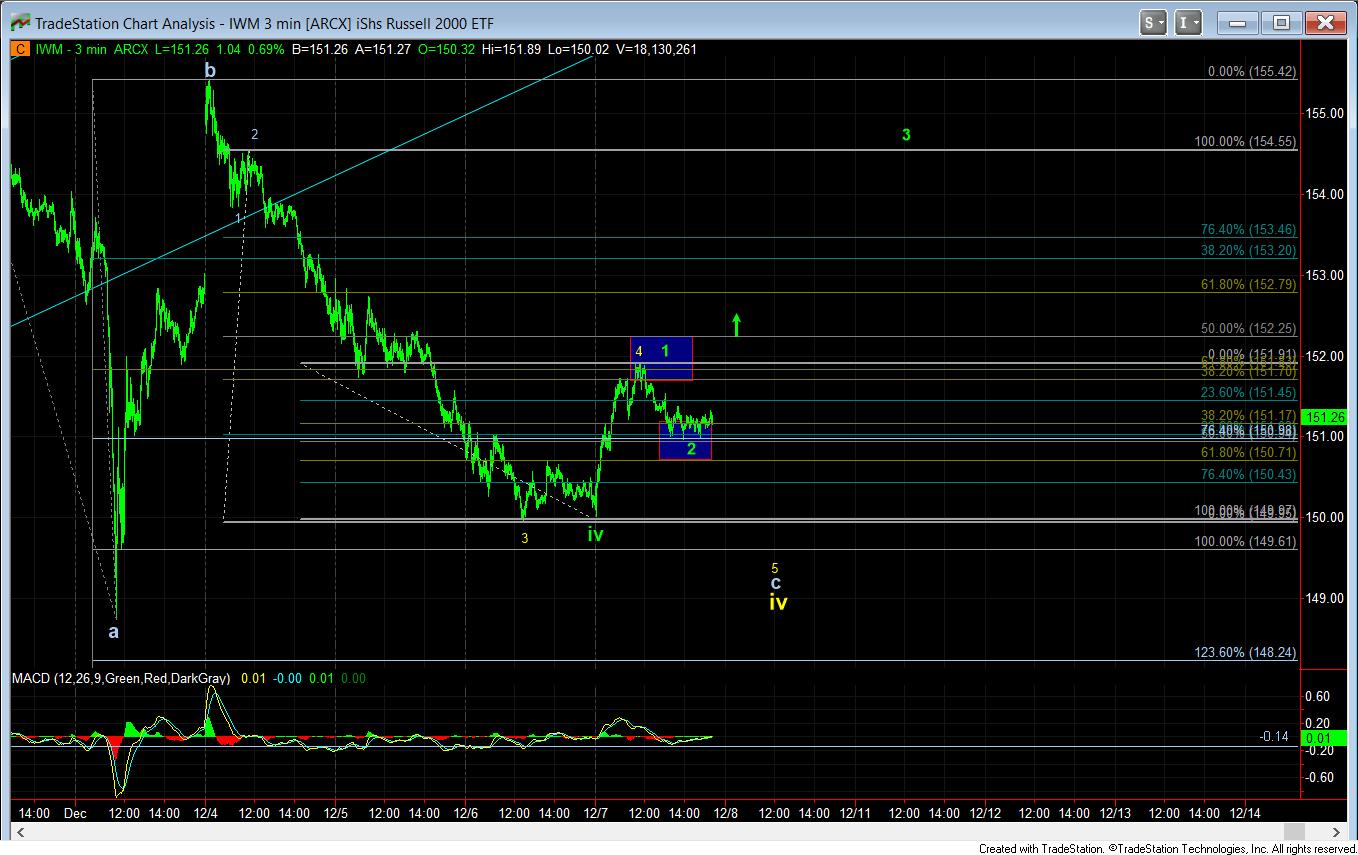
But, the high struck this week was on an emotional rally, and does not exhibit the ideal 5 wave structure which would normally complete this rally. For this reason, I have left open the potential that the high we struck early this week was only a b-wave high in a wave-iv expanded flat corrective pattern. That is how the primary count is listed on the chart, and it will remain the primary count as long as we hold the 149.50 region.
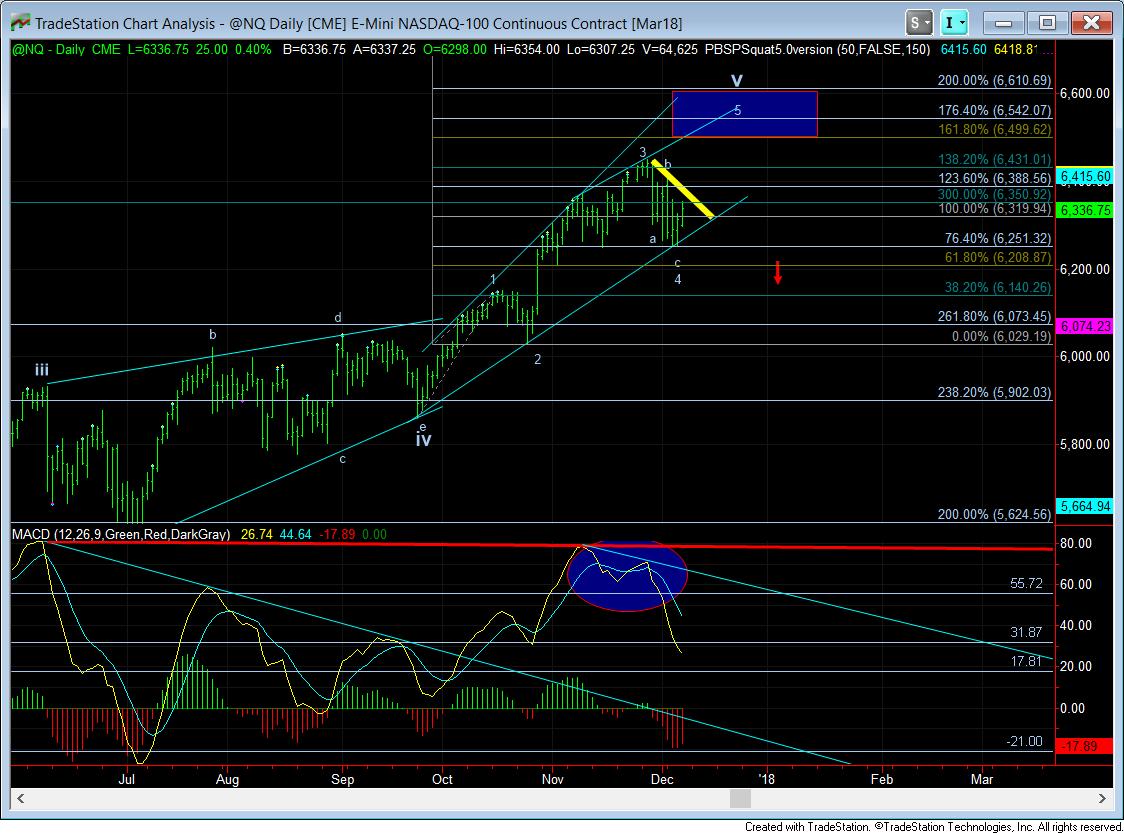
Moreover, as I have noted many times, the NQ chart still seems like it is missing its last micro 5th wave higher before we can consider it completed along with the IWM. For these various reasons, I am still looking higher one more time before I consider this pattern completed. But, please recognize how close we may be.
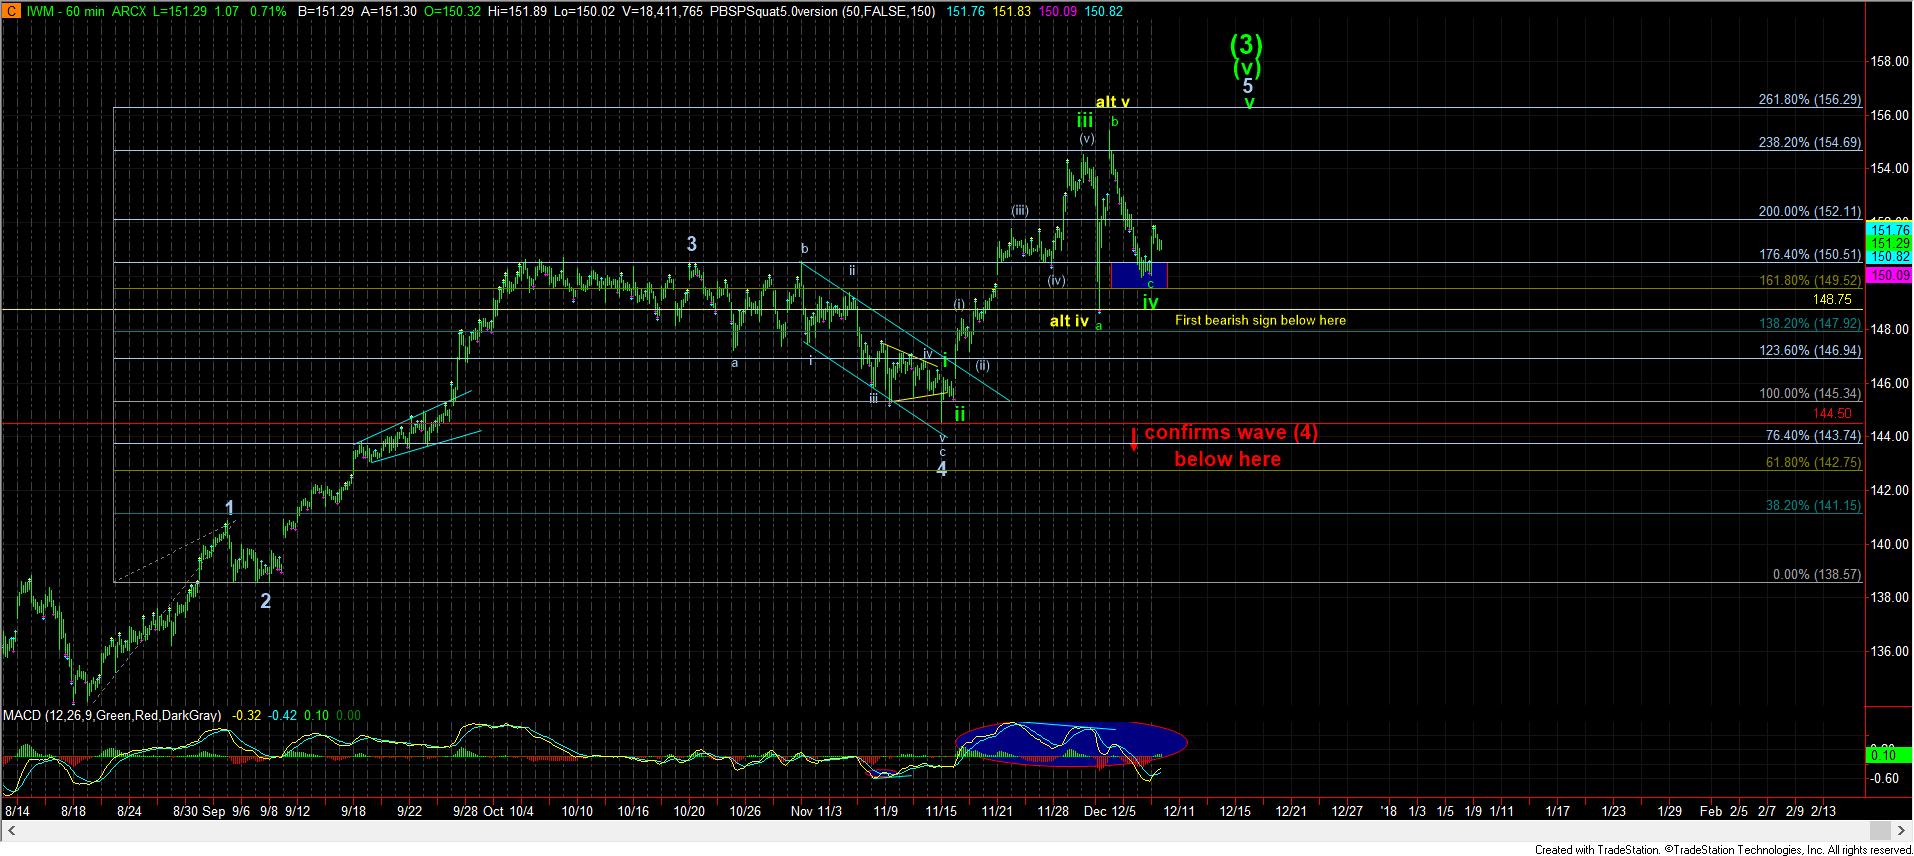
However, a break down below 148.75 will make it much more likely that the high struck earlier this week did mark the top of the 5th wave. So, it means that, even though I am still looking for one more potential rally, I am going to maintain an open mind that the upside may have been completed. Ultimately, the market has continued to provide us with wonderful parameters within the IWM chart, and we have been following it rather well in identifying the twists and turns we have been seeing of late.
Now that we have discussed the forest, let’s speak about the leaves. The rally today certainly may “look” like we have bottomed. However, that bottom was struck in a truncated manner. And, from experience, I have learned not to trust truncated patterns, as they are really quite rare. What I need to see to confirm that the bottom was likely struck today is for us to continue to rally tomorrow over the high we struck today. That should put us back on track to heading back towards the all-time highs sooner rather than later.
If we are unable to rally back through today’s high, especially in the IWM, I still see the potential for one more loop down to strike the 149.50 region before we begin the 5th wave higher. So, in the short term – next day or two – I am uncertain if we have begun that rally back up towards the highs, and I think tomorrow will provide us with that answer. But, the overall perspective remains the same: as long as we hold the 149.50 region, I look higher for one more rally. However, a break down below 148.75 turns me quite neutral to slightly bearish, with follow through below 144.50 strongly suggestive of wave (4) being in progress, with a target below of 133.
Yes, I take it one step at a time on the bearish side of the market due to the fact that we are still in a long term bull market, and the bulls have certainly earned my respect. And, since I expect this bull market to last several more years, I will continue to respect the bulls and will only aggressively short this market when it has confirmed to me that we have a bearish pattern in play. Even if we do see such confirmation, my expectation is that such a bearish pattern will not likely last beyond the first quarter of 2018, and then we will likely turn back up in a bullish trend as we focus on our next larger degree target for the SPX in the 2800-3000 region next year.