Support Still Holding - Market Analysis for Jul 19th, 2016
I noted last night that we needed to break at least the 2154SPX level to even begin consideration of the downside potential. Thus far, the market has approached the support region, but no break has yet been seen.
But, due to the nature of the last pullback, it has opened the door to the much more immediate bullish count, which I am forced to put on the chart and present. While this is clearly not my primary expectation at this time, as I would rather see a real pullback, when I ignore these setups in a bullish market, it usually comes back to haunt me.
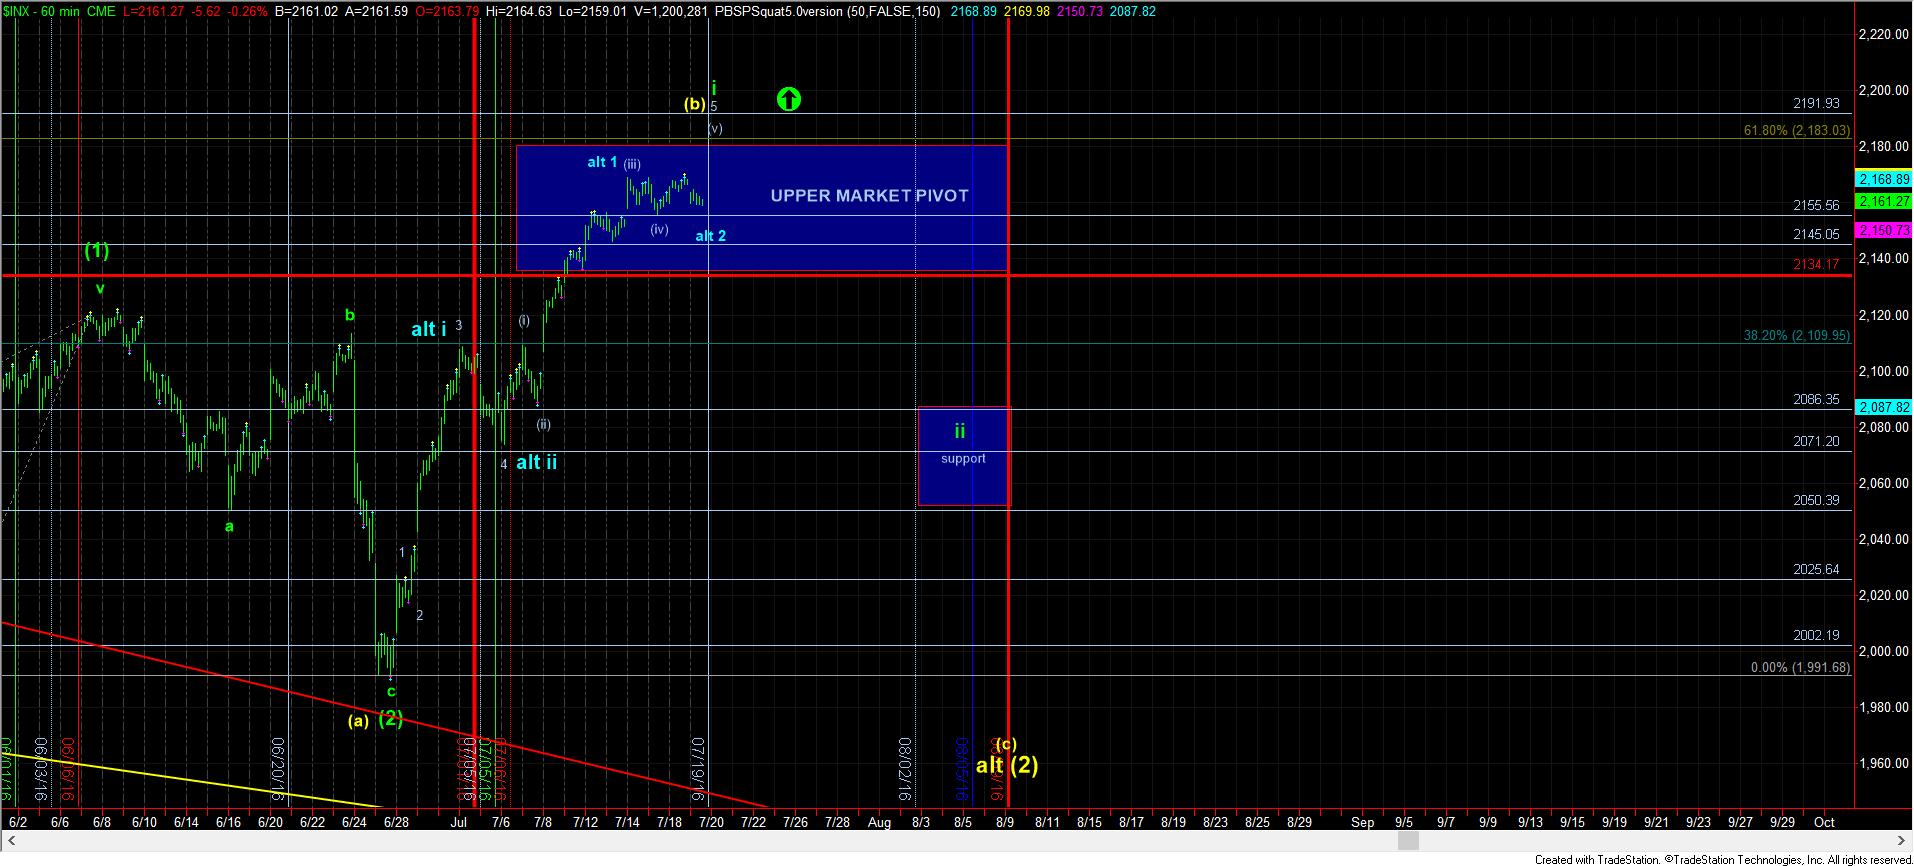
As I noted over the weekend, a break out through 2185SPX with follow through strongly over 2192SPX has me looking towards 2300SPX sooner rather than later. The blue count now puts some color to that potential. As you can see, in the most bullish potential pattern we can see, the market has a i-ii, 1-2 potential count in place, which triggers with the move through the 2192SPX region. This pattern would take us directly to 2350 for wave iii of (3), and it can happen quite quickly.
Again, this more immediate bullish count is not my primary, as I would rather see a pullback, and even a potential yellow (c) wave down. But, I simply cannot ignore the more immediate bullish potential, and I do not want anyone to be surprised by it should it follow through, especially since you can now plan on how you would react should it occur. As Ben Franklin said: By failing to prepare, you are preparing to fail.
So, we will still be watching the 2154 and 2134SPX levels for confirmation of the bigger pullback, which is still my preference, unless proven otherwise.