Market Analysis for Oct 27th, 2021
I think the title to this update says it all.
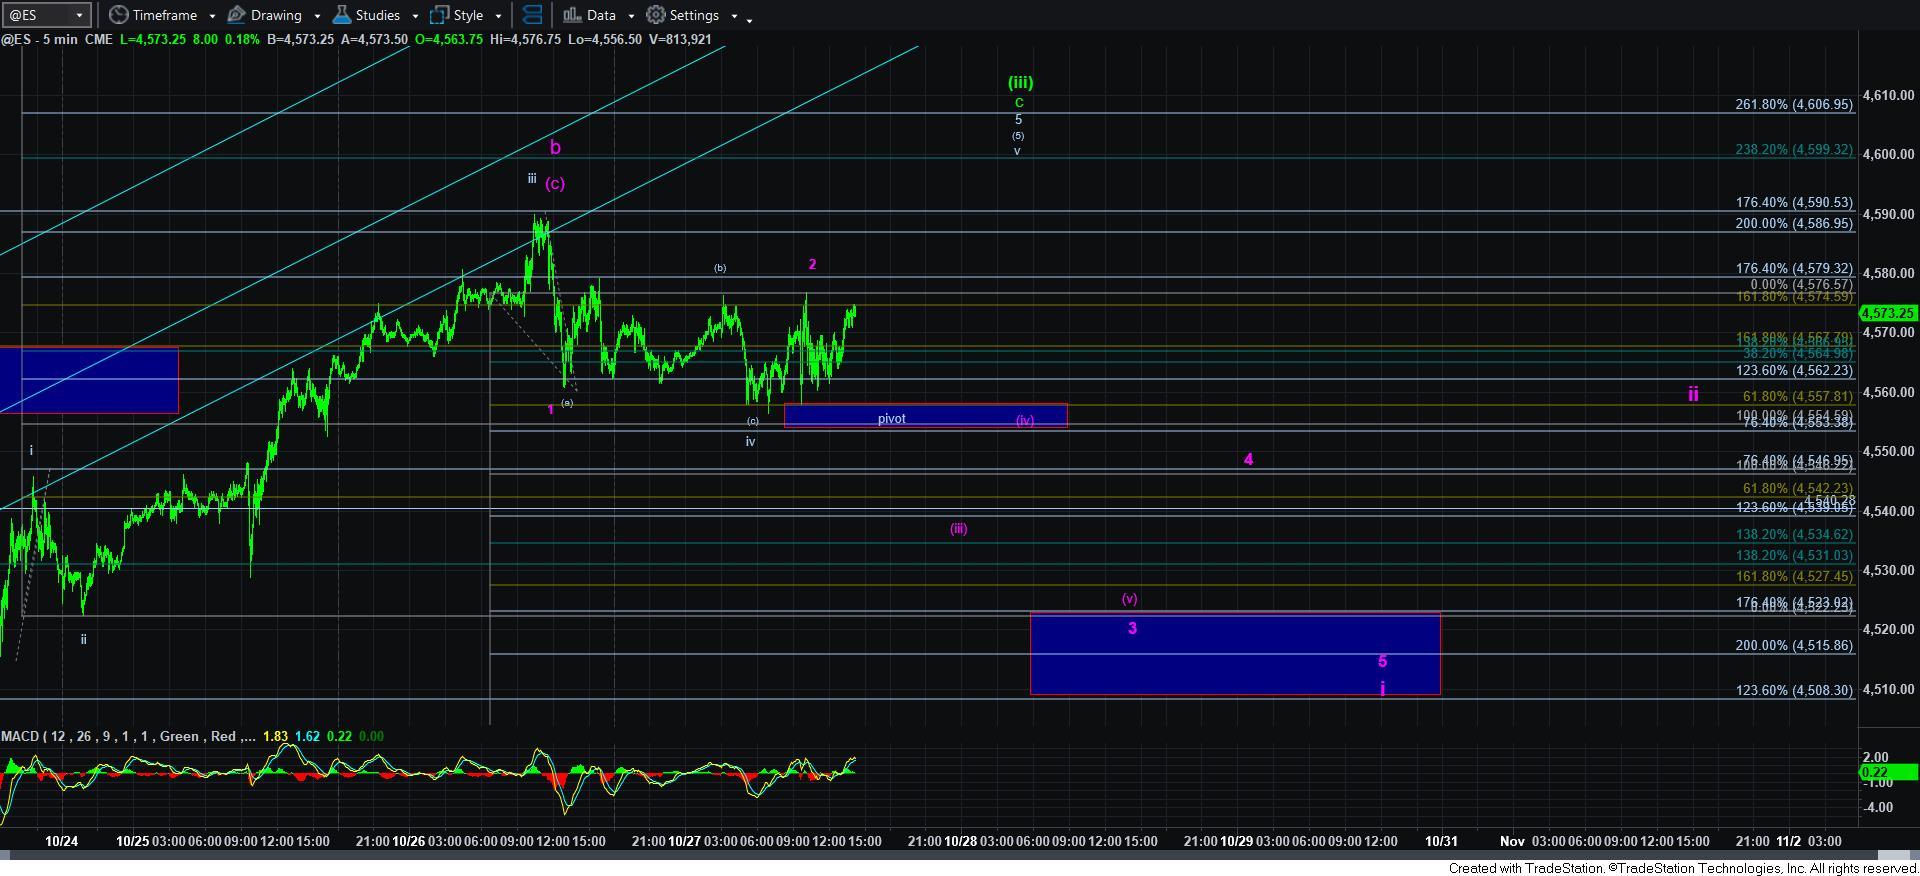
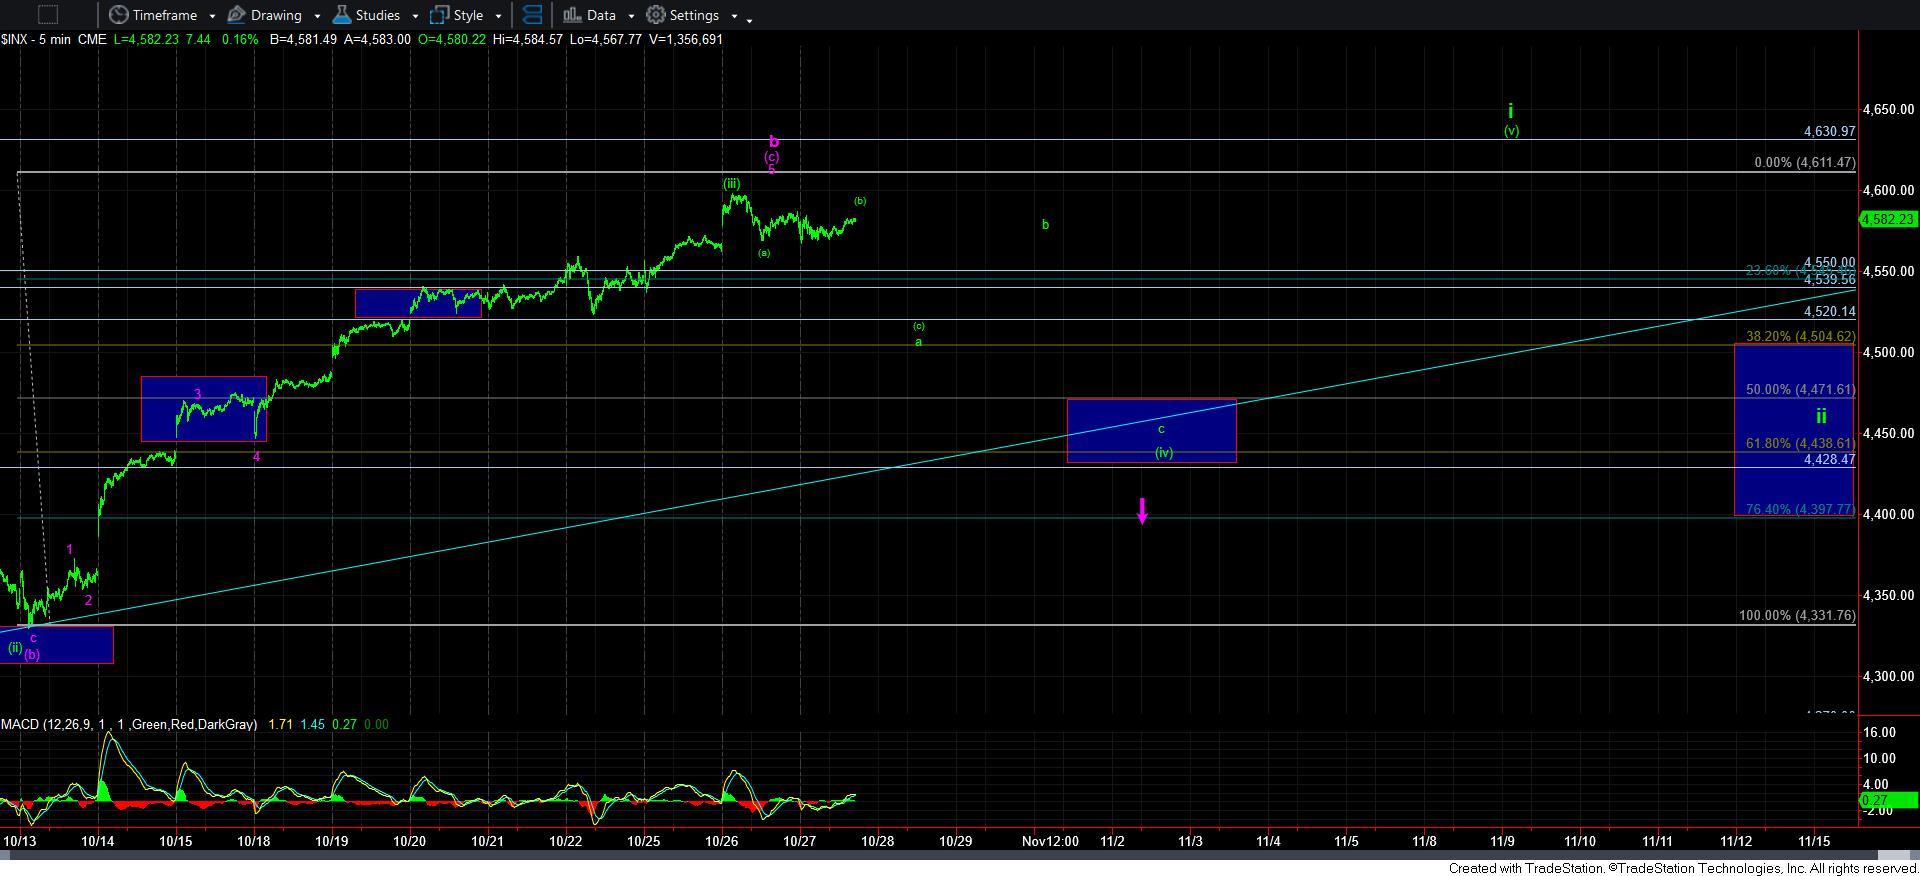
But, I still will outline the smaller degree expectations. I do not have a signal yet that the market has potentially topped out. In fact, as long as we hold the pivot I outlined on the 5-minute ES chart, we can still push higher to the 4608SPX region.
While I have added a possible downside structure for the potential that the purple b-wave has topped, I just realized that there is overlap which should not have been seen in this structure. I am not going to take it off the chart just yet, but I am now assuming that a break down below the pivot without making a higher high will likely be simply taking us lower in the green wave [iv] at this time unless we see a clear 5-wave decline into the lower box on the 5-minute ES chart.
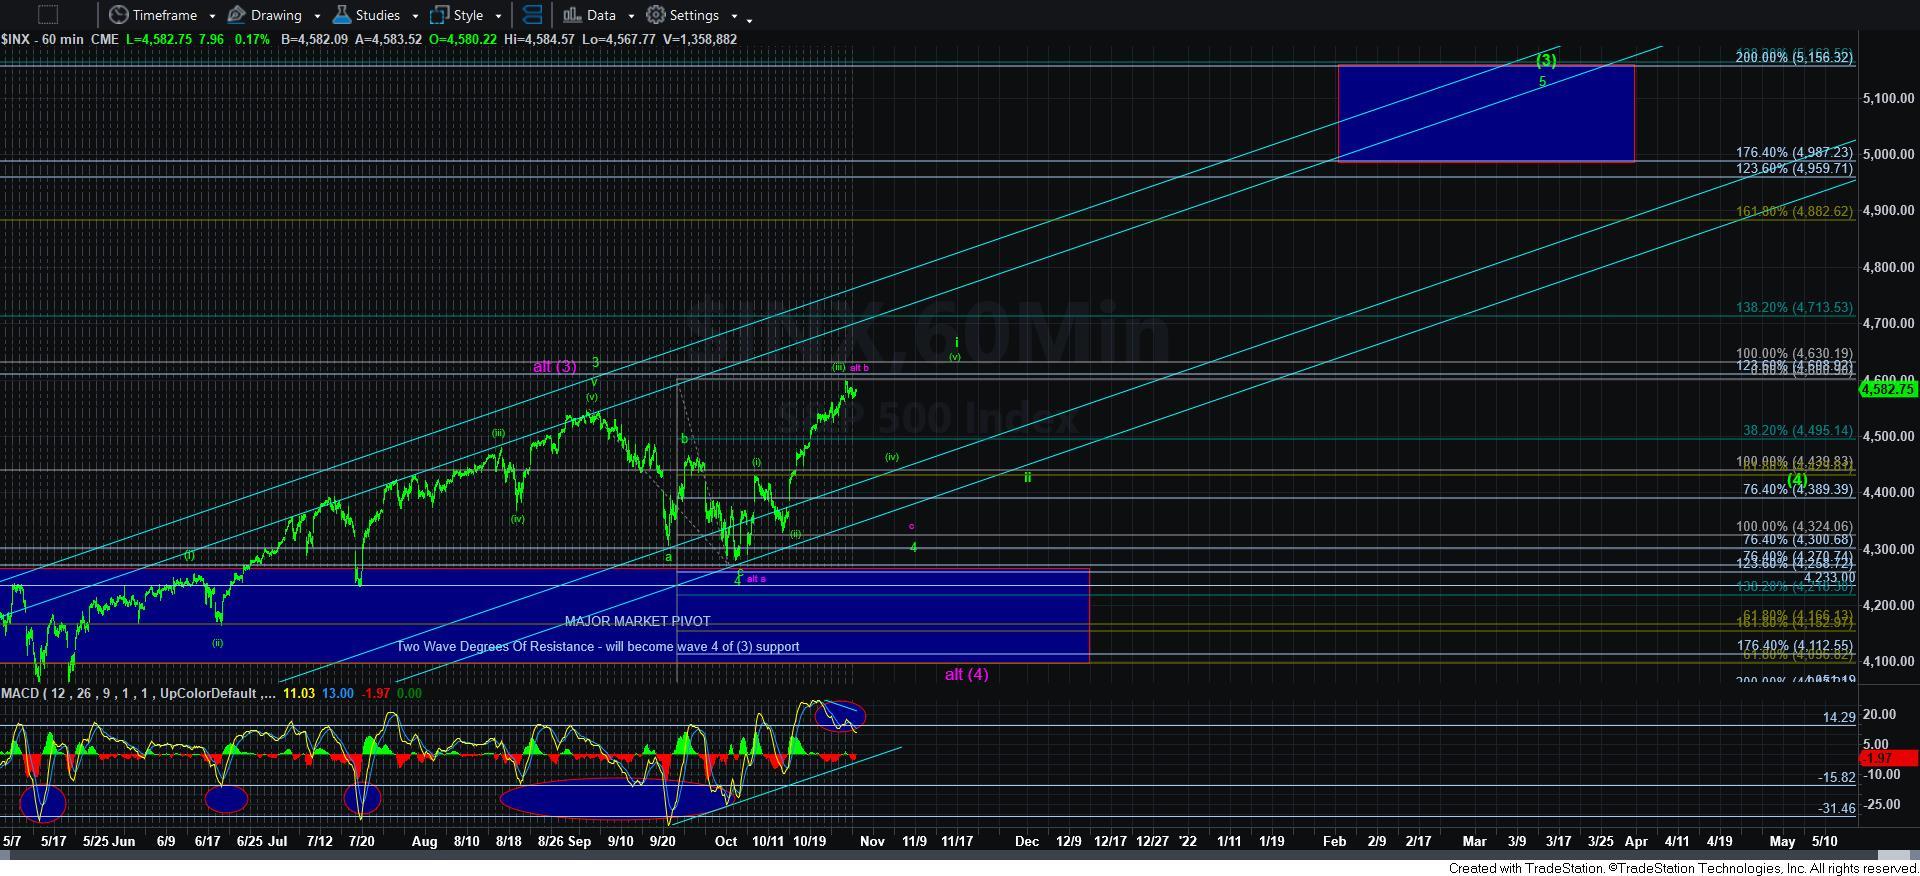
The main point I am trying to make is that I am still tracking the potential for the purple count, which can take us back down to the 4300SPX region. But, I want to state clearly that I MUST see a 5-wave decline off a high to suggest this is what the market is intending. Otherwise, any decline that does not provide us with a clear 5-wave structure keeps the bulls well in charge, and has me adopting the green count as my primary.
For now, I am not going to commit until the market provides me a clear indication as to how it will break support on the next pullback. But, the bears will have to thread the needle in order to convince me that we will revisit the 4300SPX region again. For now, I am keeping an open mind until I see how we break support.