Structure of the Next Move Down Will Help Tell the Story Into Year-End
 By
By
This strong move off the lows over the past several days has certainly exceeded my expectations and keeps the path to new highs alive. With that said, we’re now approaching the upper end of the resistance zone for a potential larger top, one that still could take us back under last week’s low, as we only have three waves up off that low.
Of course, because we are still likely dealing with an Ending Diagonal on the larger degree structure, even a three-wave start doesn’t eliminate the potential for new highs. So with that, the structure of the next move down is going to be the key piece of information to help give us a better idea as to where we are headed. That next leg will tell us whether the market has the strength to push to new highs into year-end, or whether we should prepare for additional weakness heading into the final month of trading.
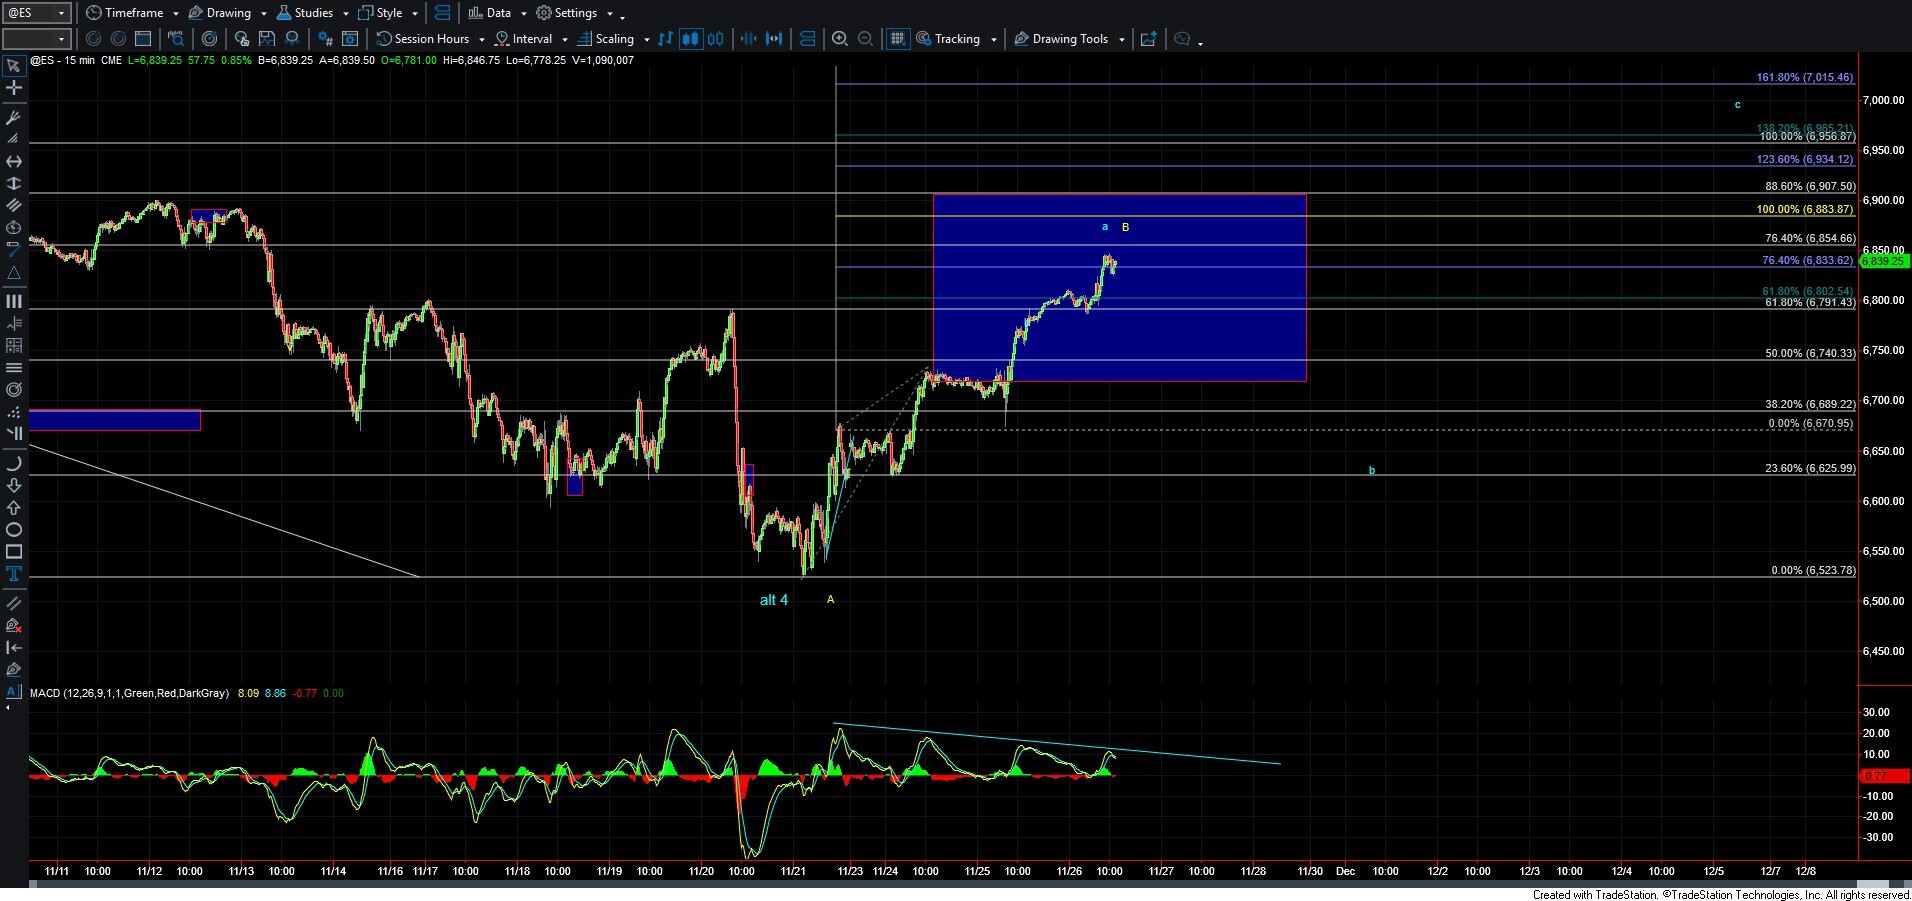
On the ES chart, the two most probable paths are shown in yellow and blue.
Blue Count:
This is the path that allows for new highs. Under this scenario, we should see a corrective retrace into the 6750–6600 region. From there, a clean five-wave rally would give us initial confirmation that wave C of 5 is underway and that the market is positioning for another push higher.
Yellow Count:
If instead we see a five-wave move to the downside, that would open the door to a larger wave C down. That path would take us well below last week’s low and could even mark a larger-degree top if key support levels, as outlined in the weekend updates, are broken.
For now, we need the market to show its hand. The next retrace and the structure it forms will provide the clarity we need as we head into the New Year.