Still Tracking An Ending Diagonal
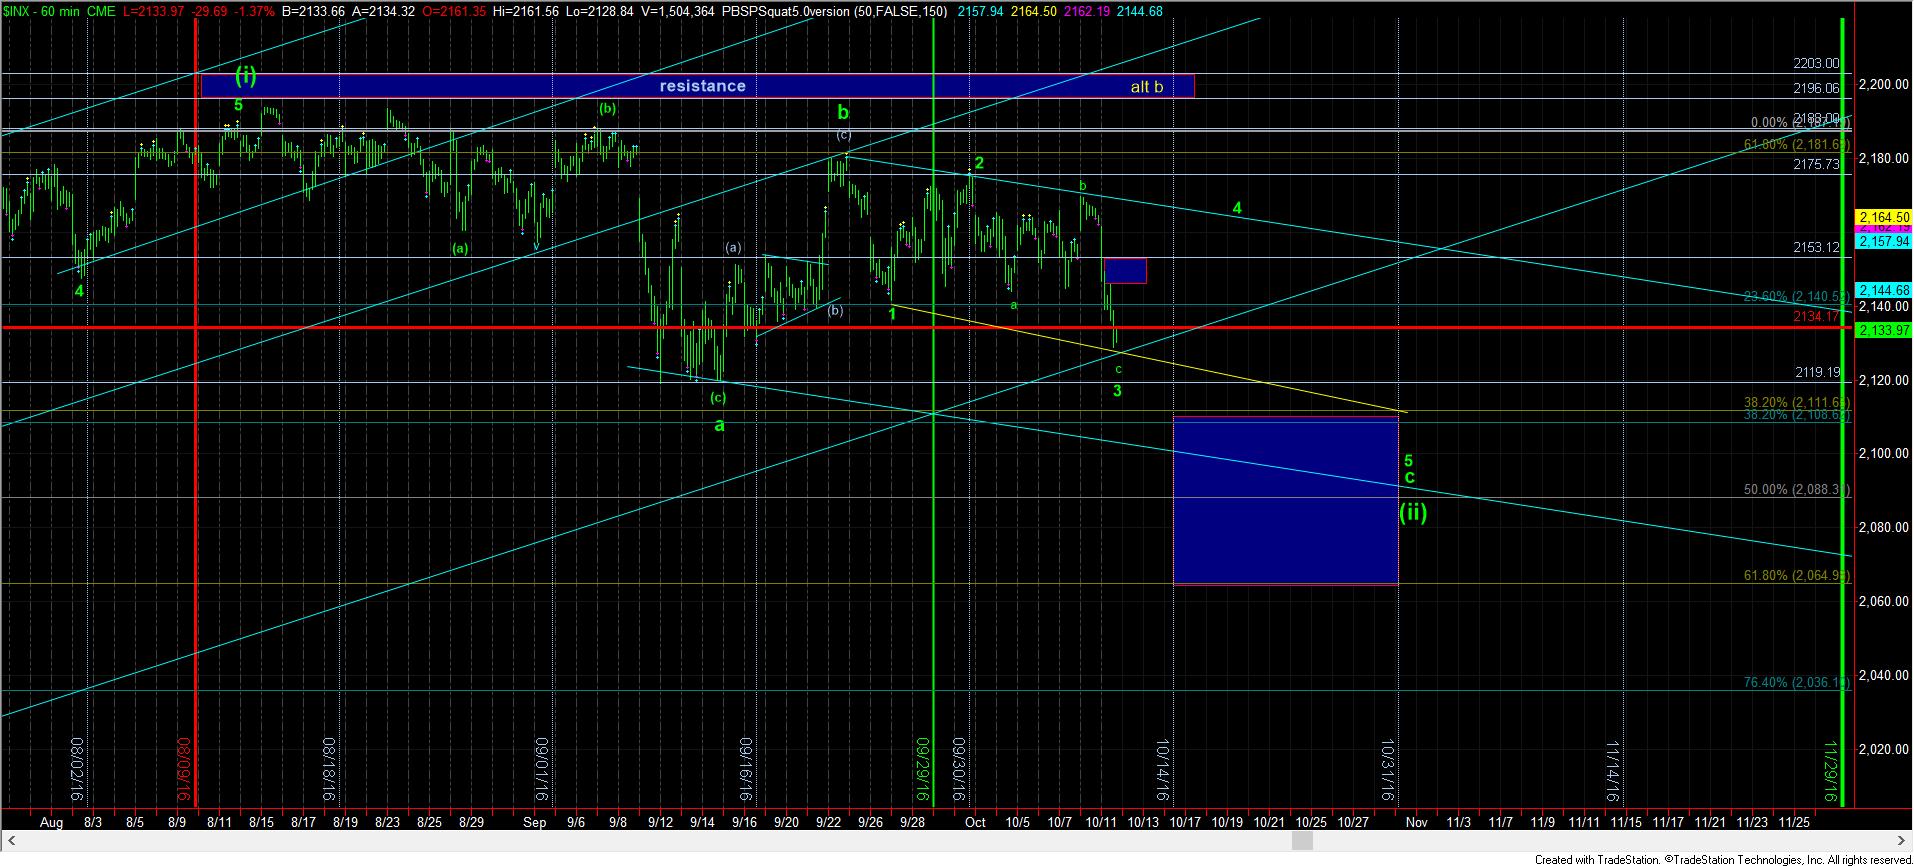
With today’s drop, we seem to be within the c-wave of the wave 3 of the ending diagonal for the bigger c-wave of wave (ii), which has been our count for quite some time. These diagonals are VERY tortuous and vicious in their moves both up and down. And, I don’t think we are done yet.
For now, we have enough waves in place to consider all of the c-wave of wave 3 down as completed. But, as we know, extensions can certainly take us lower, and much depends on how deep this wave (ii) is destined to achieve. As you can see from our 60 minute chart, the minimum target is the 2111SPX region, which would provide us with a wave (ii) flat into the .382 retracement of wave (i) of (3).
If the market is destined to only strike that region as our low for wave (ii), then wave 3 will likely be completed within the next 24-48 hours. It would be followed by a larger wave 4 which will likely take us back up towards the downtrend channel from which we just fell, which will set up a final decline later this month to complete this wave (ii).
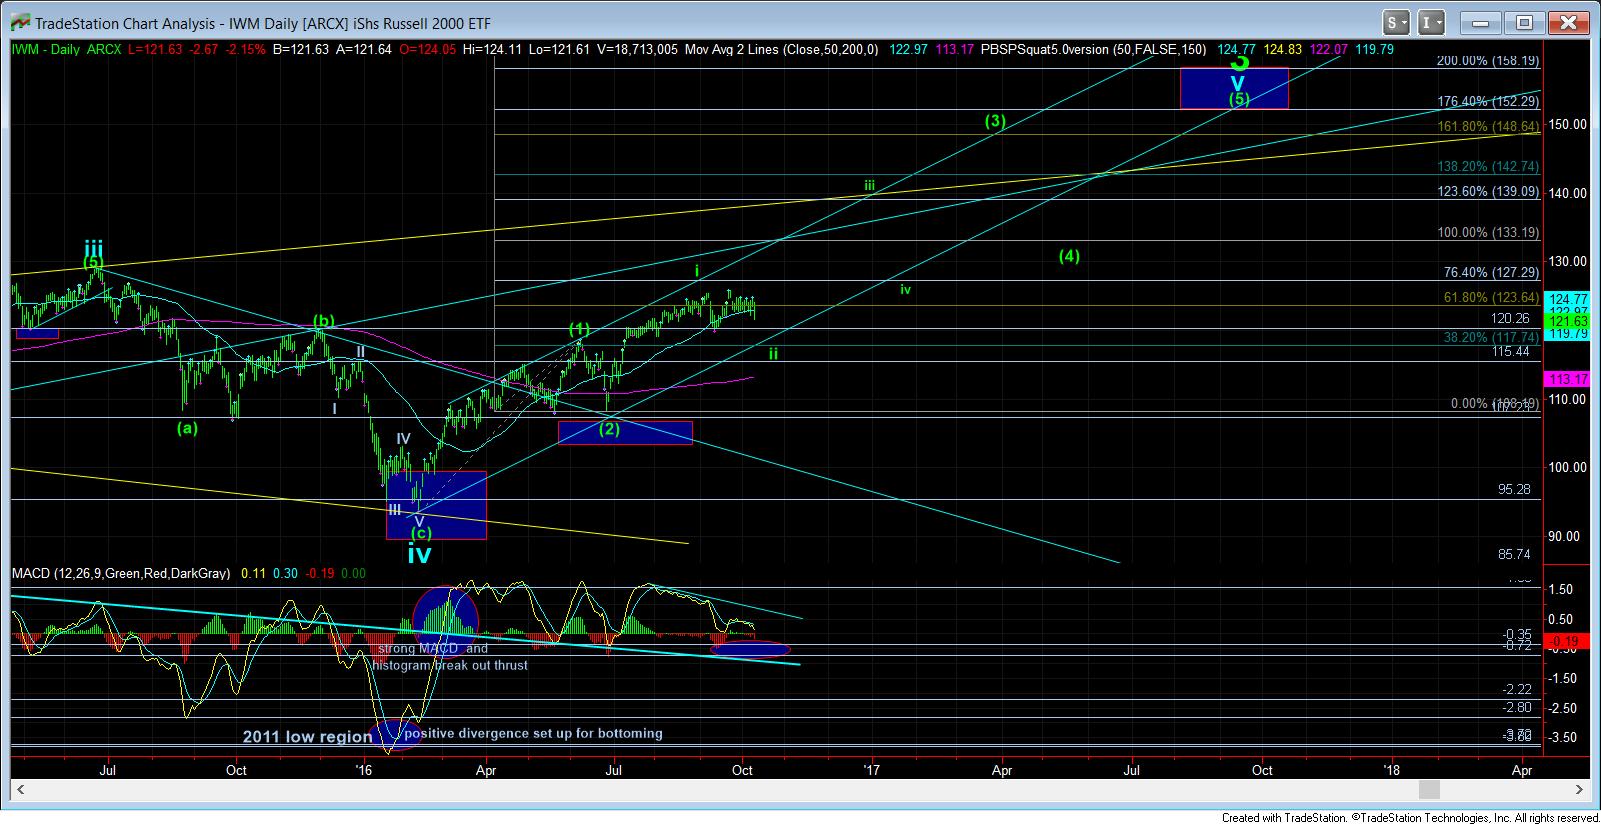
Again, I want to reiterate that nothing in these charts is suggestive of the longer term bull market as having come to an end. Rather, as long as our support holds, it is suggestive that much higher levels are still to come. While we can certainly be wrong, the market has been playing along in our Fibonacci Pinball structure quite well all year, and until it breaks a support, our primary count will remain looking higher into 2017.