Still Over Support - Market Analysis for May 14th, 2018
With the market remaining well over support noted over the weekend at 2693SPX, we continued higher this morning.
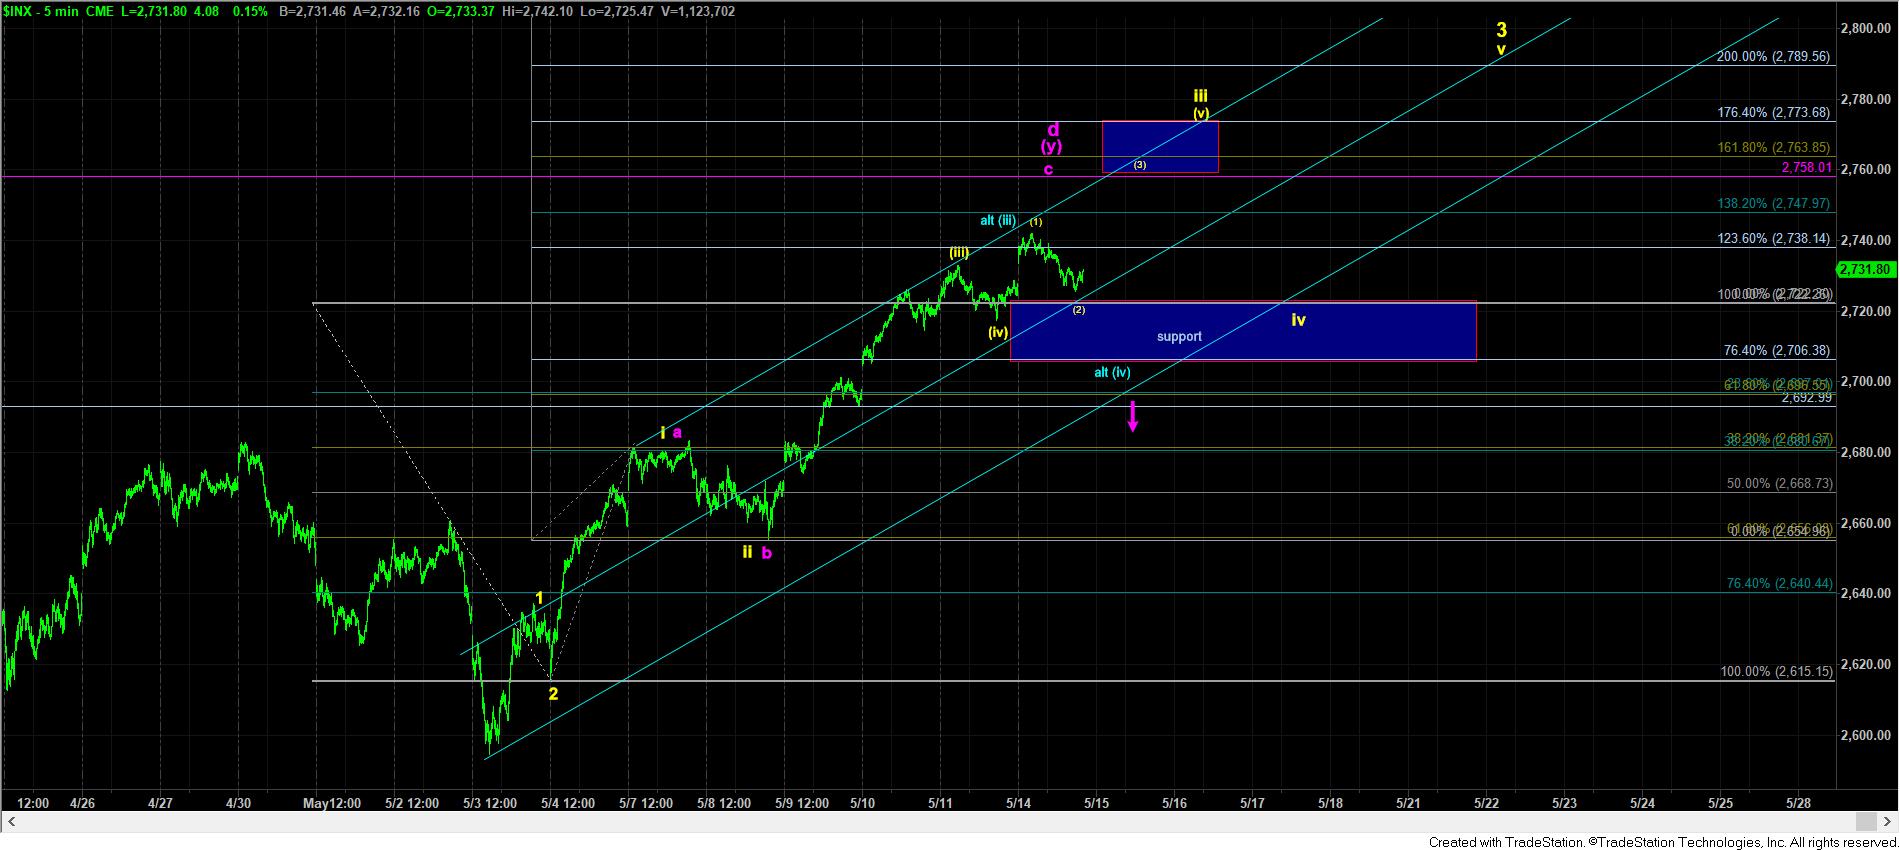
The move up towards and a bit through the 1.236 extension on the 5 minute chart suggests that I should move our support up a bit. When we rally to the 1.236 extension, ideal support is then moved up to the .764 extension in the 2706SPX region. So, if the market has intentions of eclipsing 2800 in the coming weeks, that is now the level that should hold.
Moreover, there is a micro pattern in a (1)(2) noted on the 5 minute chart, which if it holds over Friday’s low, can point up as high as the 2773SPX region for wave (v) of iii in the yellow wave count.
As far as the triangle is concerned, the ideal target for the d-wave of the triangle is the 2758SPX level, wherein the y-wave would be equal to the x-wave, as shown on the 60-minute chart. And, as long as the market remains below that level, I can still consider this a reasonable count to follow. But, as I said over the weekend, we need to see a break of support to suggest this is the operative count. And, as long as we remain over 2706SPX, I cannot rely upon the triangle just yet.
Now, in our chat room at Elliottwavetrader.net today, there was discussion about a bigger b-wave, which I highlighted as a potential last week on a daily chart I sent out as an alert. And, I will take a moment to mention here again.
If the market continues higher over the coming weeks, and we complete 5 waves up, there are two potentials we will have to follow, but both point lower once 5 waves up completes.
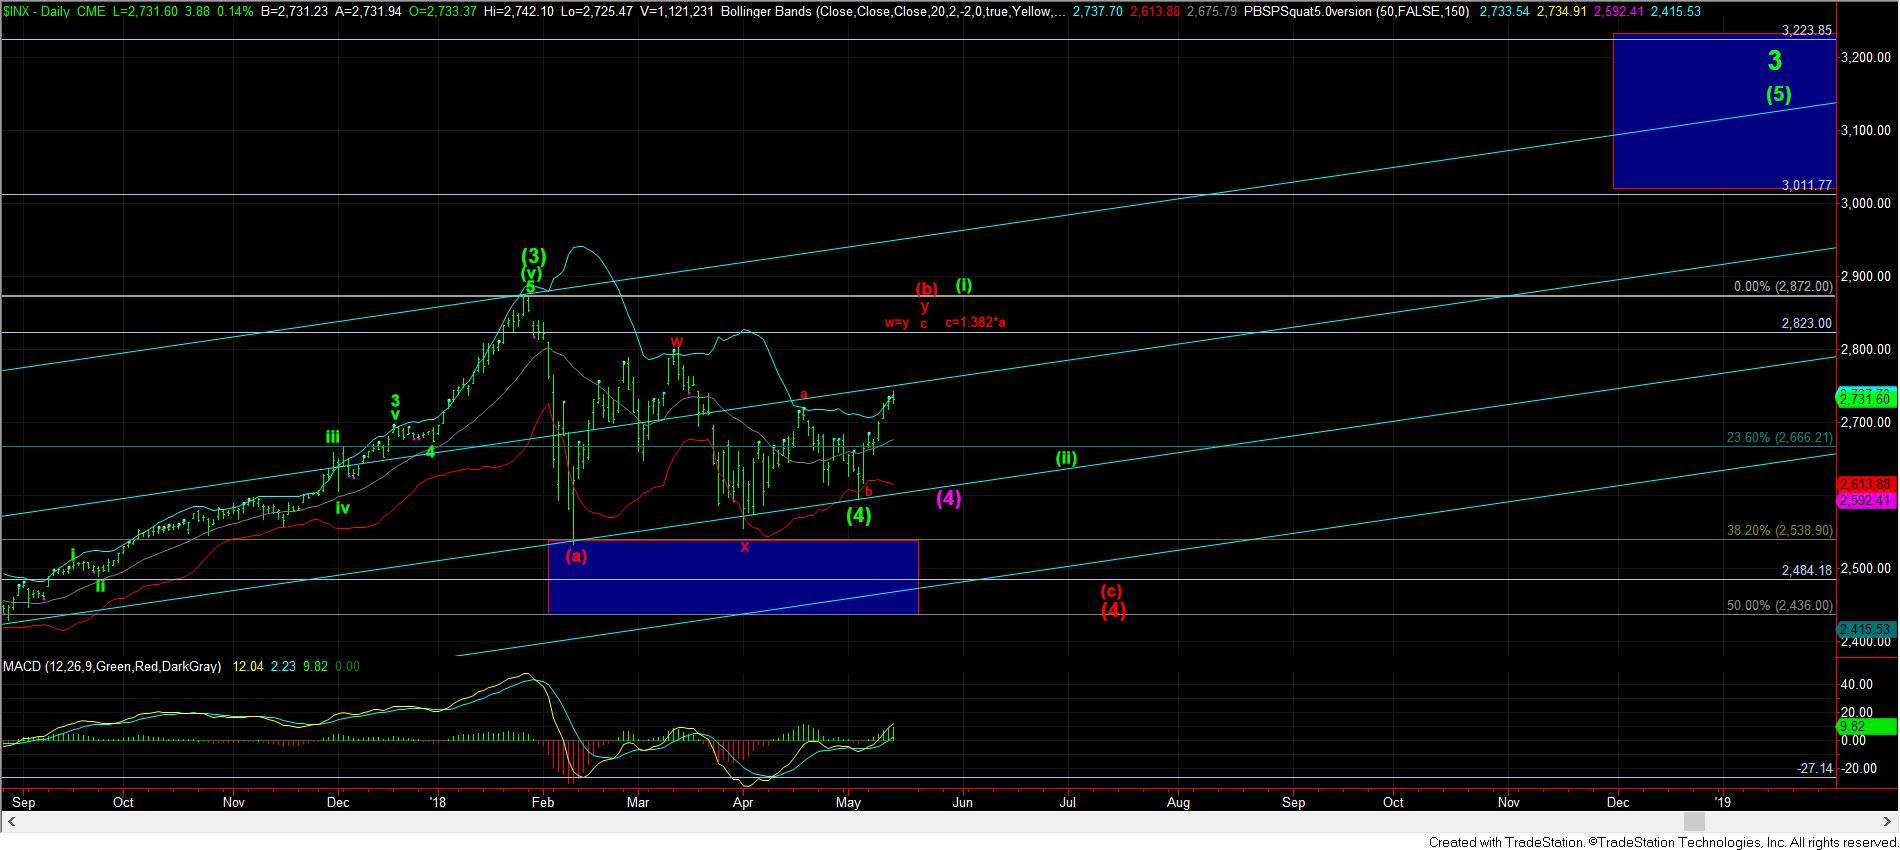
The first is the green count on the daily chart, which suggests the next pullback will be a wave (ii), which will hold over the low struck before we began this current rally.
The second is a bigger a-b-c structure in a larger degree wave (4). But, I want to note that this slightly more bearish count would point to a top at 2823. You see, that is the level where the bigger y-wave would be equal to the w-wave, and it is also where the c-wave of the y-wave would be equal to 1.382 the size of the a-wave. So, if this 5 wave structure tops right at that level, that would give us a strong clue that the next drop will likely be pointing to just below the 2500SPX level to complete a much bigger wave (4) flat.
But, I want to note that this bigger wave (4) structure still needs a lot to confirm that potential, so just keep it in the back of your mind for now. At this point in time, all we have to focus upon is if the market maintains support over 2706SPX in the coming days.