Still No Signal of a Top as we Continue to Push Higher
 By
By
Today we continued to extend higher still not giving us any signal that we have even a local top in place in the SPX. So with that I will simply re-post a review of the counts as I posted at the close yesterday as they are all still applicable and relevant with the action that we saw today.
------------------------
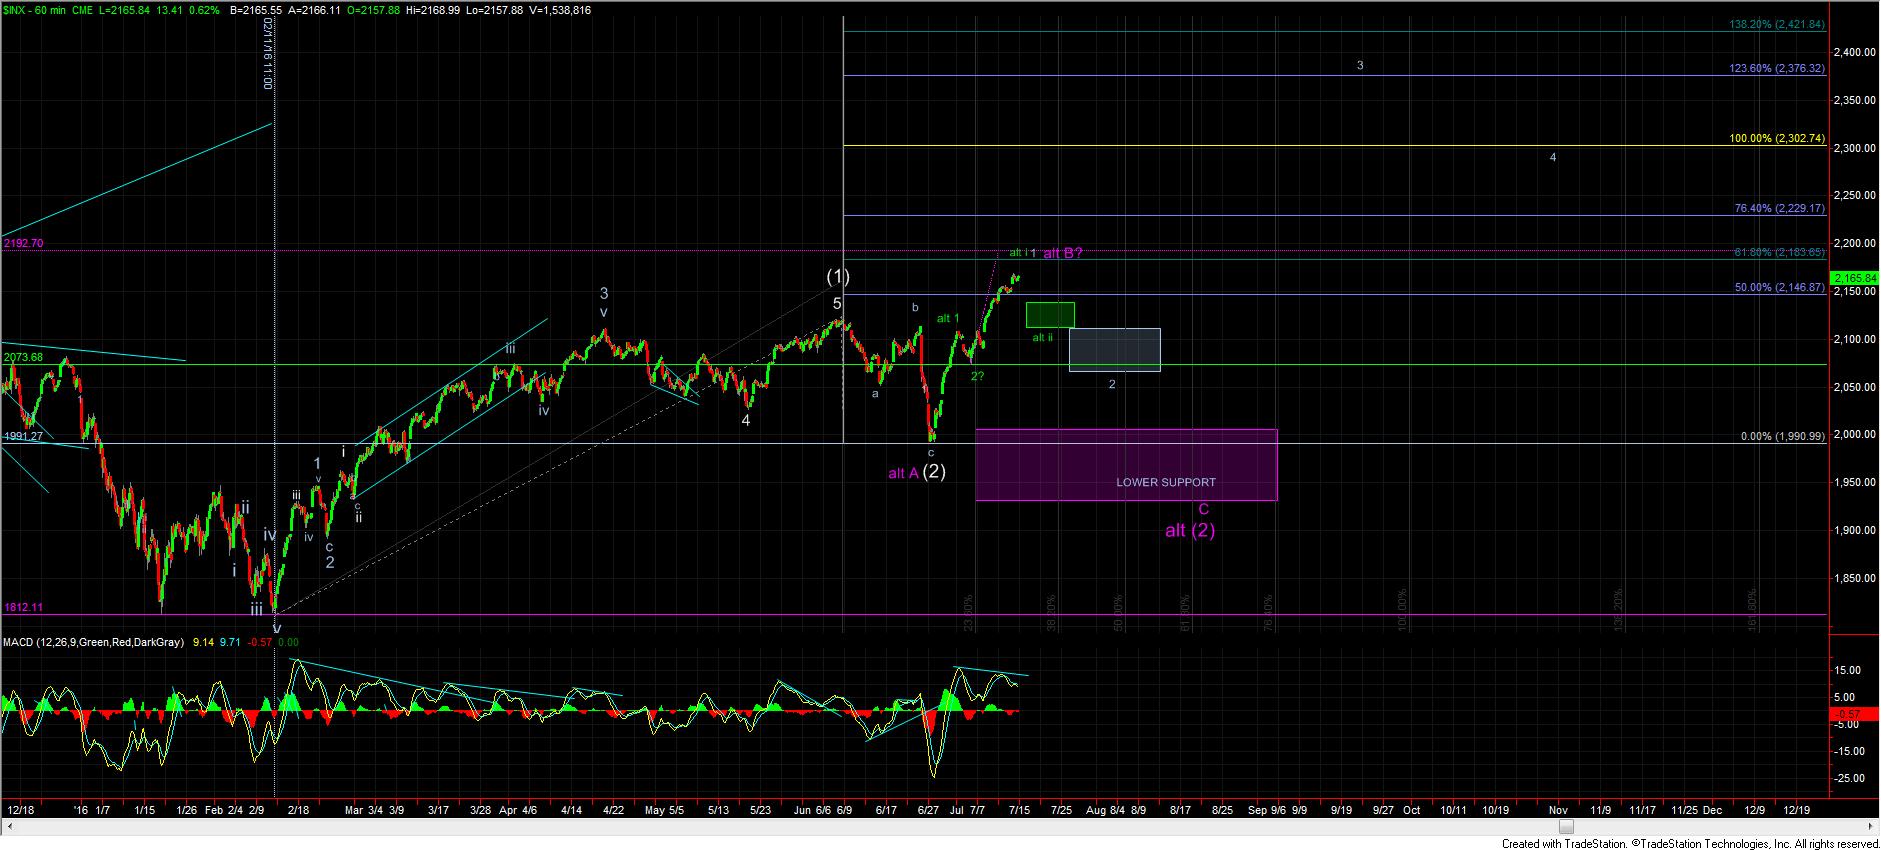
White Count - The white count is my base case at this time and is suggestive that the entire structure off of the 1991 low is a wave 1 within a larger degree wave (3) that will ultimately target in the 2500-2600 area. Current support for wave 2 under this case comes in at the 2111-2067 zone although given the back to back impulsive wave structure off of the February lows it would be ideal to hold closer to the upper end of that range as this is quite common on strong back to back impulsive wave structures.
This count is not without it's issues and is by no means perfect. The most significant issue that I have with this count is the length of the wave (v) within the wave 1 under this count (the move off of the 2073 low). At it's current length this move is approaching an equal distance to the wave (iii). Now while having third and fifth waves that are equal in size to each other is quite common in fear type instruments like the VXX, metals and commodities it is less common in the stock indices. With that being said however it is certainly possible that this fifth wave is indeed a fear based move with that fear being the fear people may be feeling in the form of the fear of missing out or FOMO.
Furthermore from a purely Fibonacci pinball perspective we have very good fit within our guidelines for a (1)-(2) 1-2 with wave 1 of (3) currently projected to top within the 50% - 61.8% extension levels which come in at the 2146 -2183 levels respectively. Now should we move past the 61.8% extension level then it would be the initial signal that we may be dealing with something other than a larger degree (1)-(2) 1-2 to the upside as is shown in white on the chart.
------------------------
Green Count - The green alternate count has a more immediately bullish path than what is projected under the white count. Under this green count we still are counting the move up off of the February low into the June high as a large degree five wave structure for a larger degree wave (1). The green count however would count the July 1st high as the top of wave 1 and the July 6th low as the bottom of wave 2. This would put us already in the heart of wave 3 of (3) up on our way towards the much higher targets in the 2500-2600 region.
We still should ideally see a local top for wave i of 3 of (3) soon under this green count given that this case is suggestive that we are in the heart of a larger degree wave 3 of (3) to the upside that top may very well be followed by a very shallow retrace for wave ii. Current support for this wave ii retrace under this case comes in at the 2137 -2111 zone but again given that under this case we are in the heart of the strongest move up it would be more likely that the retrace is more towards the upper end of that support zone if we are indeed following the green count.
------------------------
Purple Count - Finally we are left with the purple count which is suggestive that this entire move up off of the 1991 low is a large expanded B wave. This count is suggestive that the low we saw at the 1991 level was actually only the wave A of (2) and not all of wave (2) meaning that we still need to see a large C wave lower prior to commencing our larger degree wave (3) to the upside.
While this count is certainly a valid alternative IMO it is the least probable of the either the white or the green counts at this point in time. Now should we see a large five wave move to the downside that bottoms around the 2100 area for a wave i of C then the odds of this purple count playing out will certainly increase. Until and unless we do see that five wave move down and as long as we are over the support levels noted above I have to give preference to the bullish counts at this time.