Still No Downside Trigger
With the market pushing higher through yesterday’s high, we have made it much less likely that an imminent break down is going to be seen. Rather, the current pattern provides support in the 2615/20 region, and pointing up to the 2710 region next.
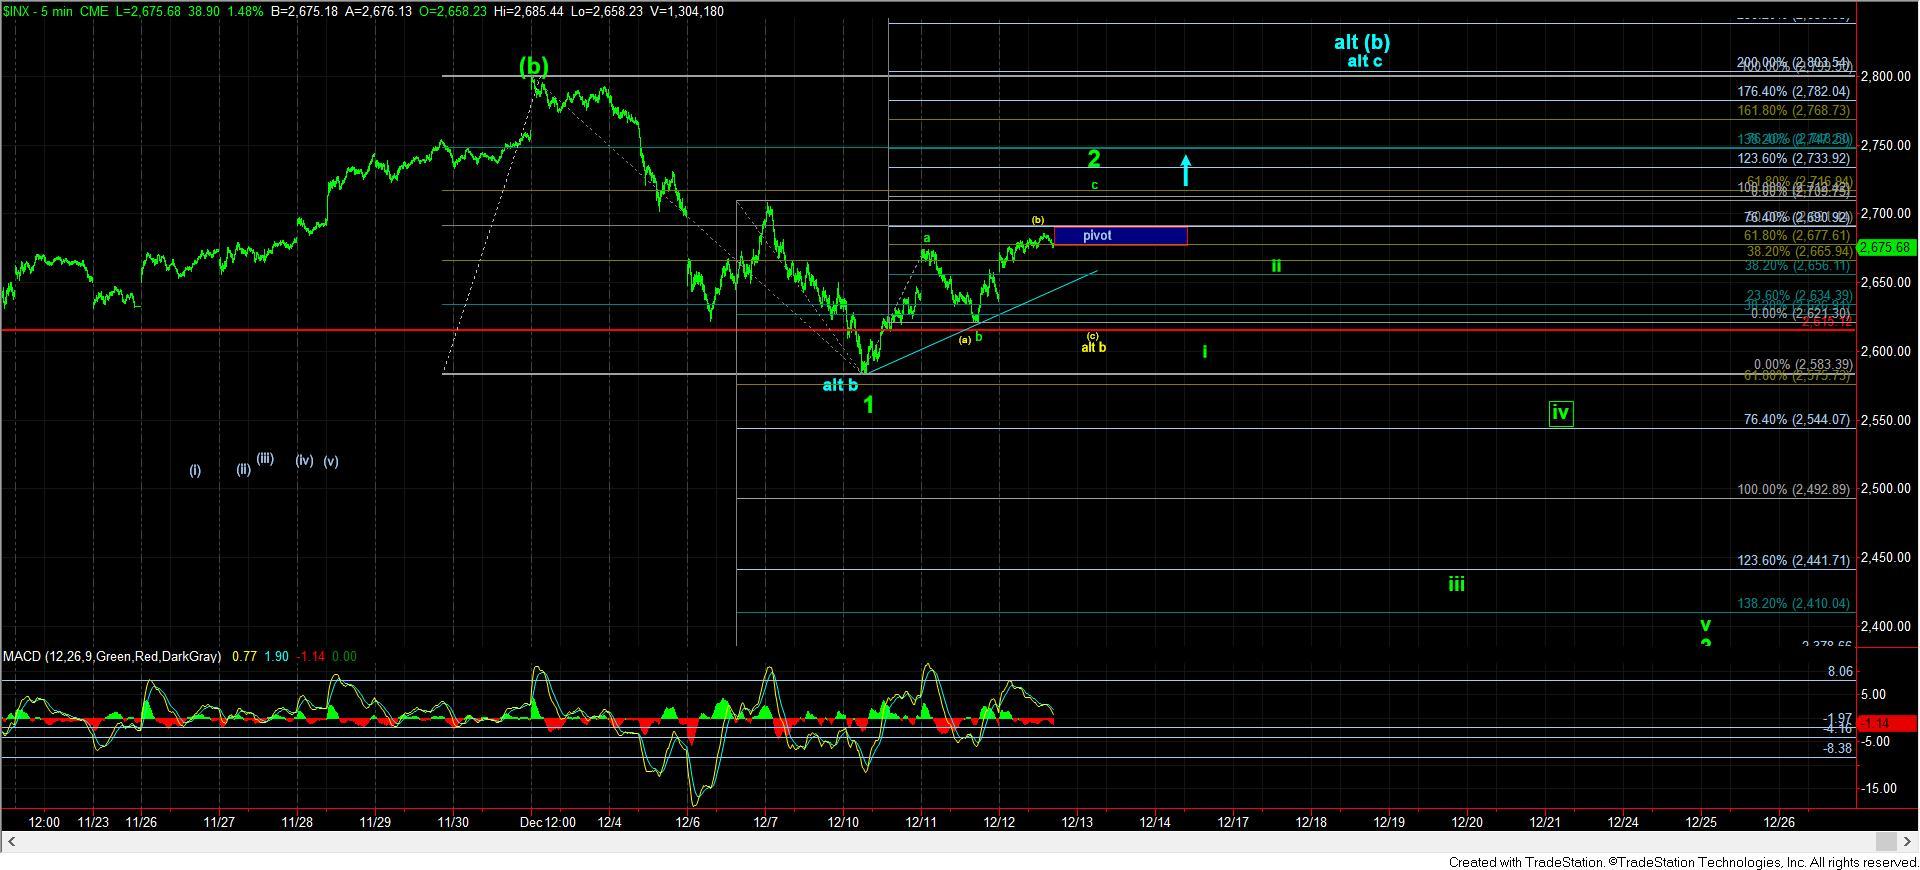
I want to start by addressing the current more immediately bearish count, which is presented in green. Most specifically, the rally today suggests that this would still be part of wave 2 within the green count. And, within the green count, either we will continue higher towards the 2710SPX region to complete the c-wave of wave 2 directly, or we will drop down for a more protracted b-wave, as presented by the yellow alternative. But, the action today suggests that we will likely still need to rally to at least the 2700 region before the market has a reasonable set up to break down.
The main reason I don’t see the strong likelihood for an immediate break down is that this second move up off this week’s low is only 3 waves. That suggests that either it is a (b) wave within a b-wave of an a-b-c structure, as shown in yellow, or we will continue to move higher to complete a 5-wave c-wave. So, due to this internal structure, it makes it less likely we see an immediate break down below 2615SPX from here just yet.
However, I want to reiterate the issue I see with the green count. With a larger 1-2 set up, as we would now likely have to count this from the more immediate bearish perspective, it can project down as deep as our ultimate 2100/2200 target a lot earlier than I had expected. While it is certainly within the realm of possibilities for this to occur, it just seems a bit short in time for this 4th wave to reach its conclusion within the next couple of months. For this reason, I am still strongly considering the potential for the bigger (b) wave rally, as presented in blue, or potentially even another twist that I am unable to foresee at this moment.
So, I am sure many of you are asking yourself how you will know the difference between green and blue? Well, I have added the pivot on the 5-minute SPX chart for this purpose. Should we remain below the pivot, we can still drop down in the yellow alternative for the b-wave. But, that will likely hold support over 2615, and still point us higher in a c-wave to the 2710 region. However, once we move through this pivot to the 2710 SPX region, if we then drop back below the pivot (bottom being at 2675) – especially if it is with a 5 wave structure – that suggests the bigger decline has likely begun. However, if we are able to maintain over that pivot, it opens the door to the 2800 region for the bigger (b) wave rally.
As I explained in last night’s update, I am still allowing the market to develop until we have that strong set up to break down. And, while it will still take more patience, and the market will likely continue to whipsaw during that time, I am going to reiterate my suggestion upon being focused upon capital preservation. Remember, the goal of this 4th wave is to wipe out the gains made during the prior 3rd wave. Do not let that happen to you.