Still Looking Higher - Market Analysis for Jan 22nd, 2024
This morning, I wrote the following synopsis of my smaller degree view of the market, and I think it is something we can use for at least the next few days, and potentially over the next week. So, I am simply going to repost it as our afternoon update:
"Here is my color comment to start the week on SPX/ES.
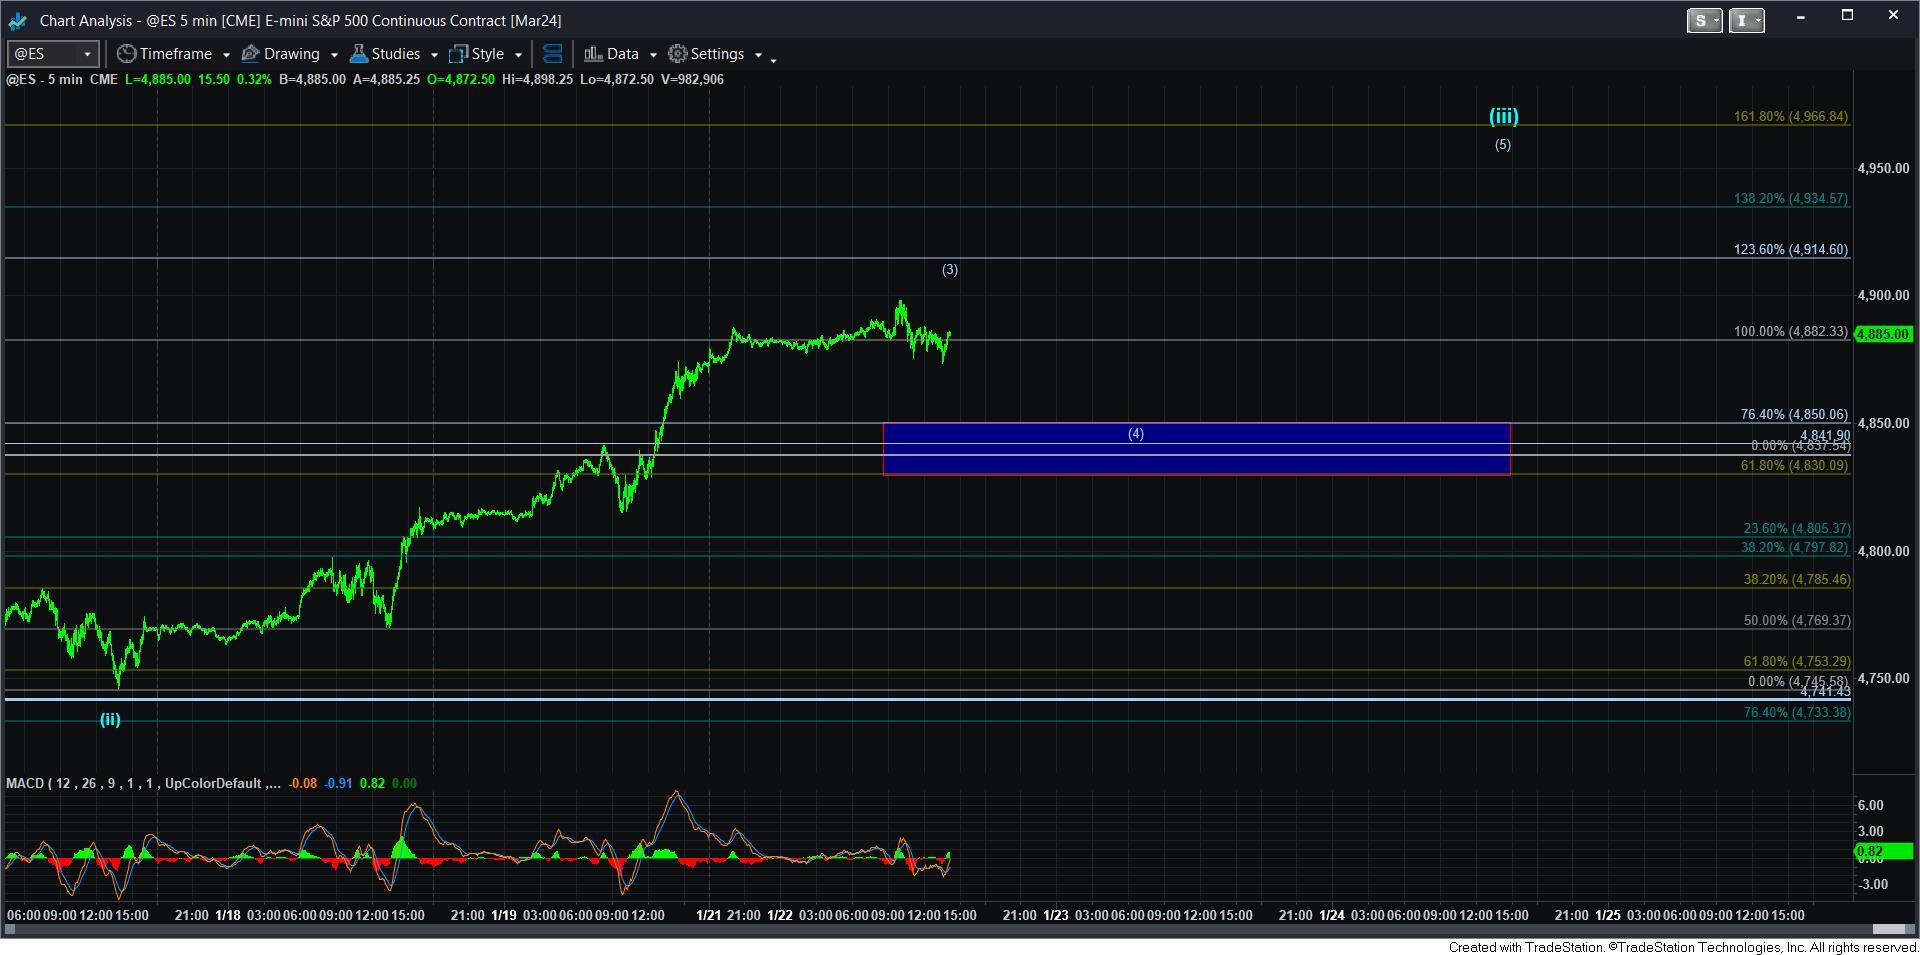
As you may remember, the ES broke the .618 upside extension enough a week ago (in the overnight trading) to make me lean towards the yellow count. Yet, the SPX only had a marginal break. So, because we had a bigger break on lower volume overnight trading, the question is if we rely on the ES structure to provide our upside projections, as they would be much higher than the SPX since wave (i) is larger i ES with the lower low?
So, I am going to give you both to track. For now, in the blue count, this should be wave (3) of (iii), with the expectation of a pullback (yes, I know, a word that has not been used for the last several months) for wave (iv), and support in SPX is the .618 extension of waves (i)(ii) in the 4789SPX level. And, as you can see, the pivot box on the ES chart is shown as well.
The main point is that as long as the next pullback is corrective, and we hold that support, we should be setting a rally in wave (5) of (iii).
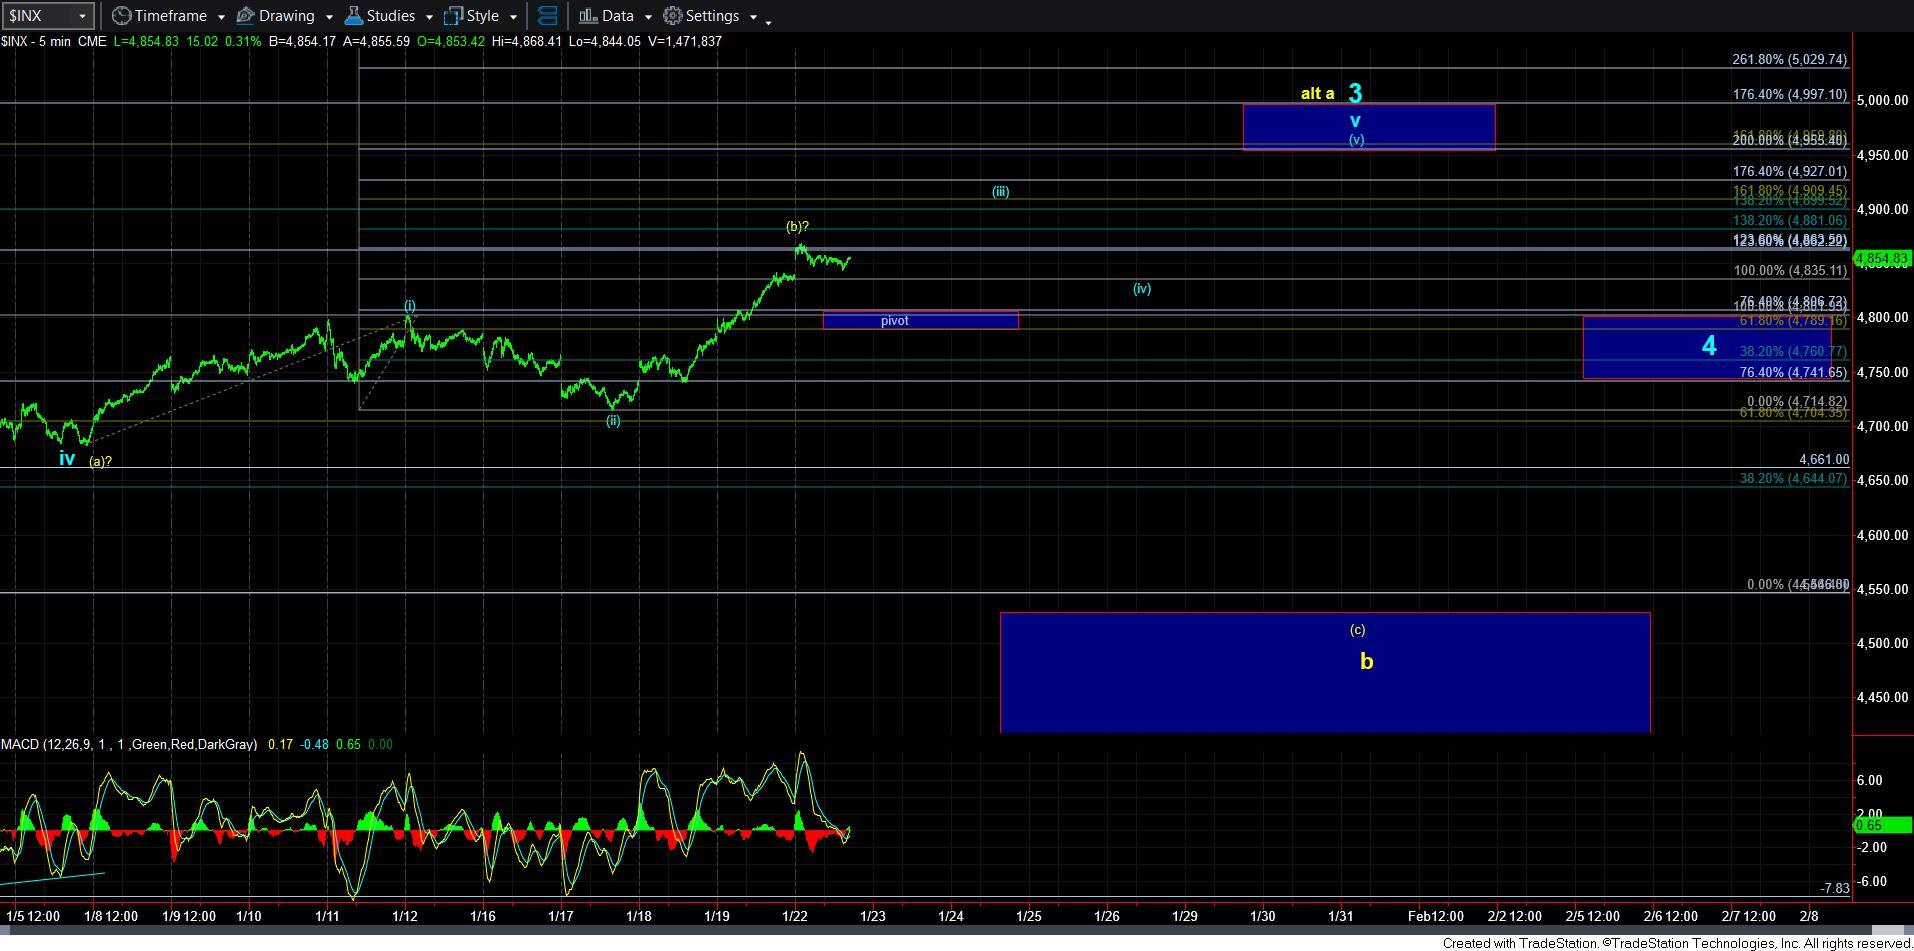
And, take note that the blue box for wave (v) of v of 3 in SPX takes both projections (ES and SPX) into account when I made that target. The ES projects to the upper part of the box, whereas the SPX is the lower end.
Alternatively, an impulsive break down below 4789SPX opens the door again to the yellow count."