Still Looking For Another Rally
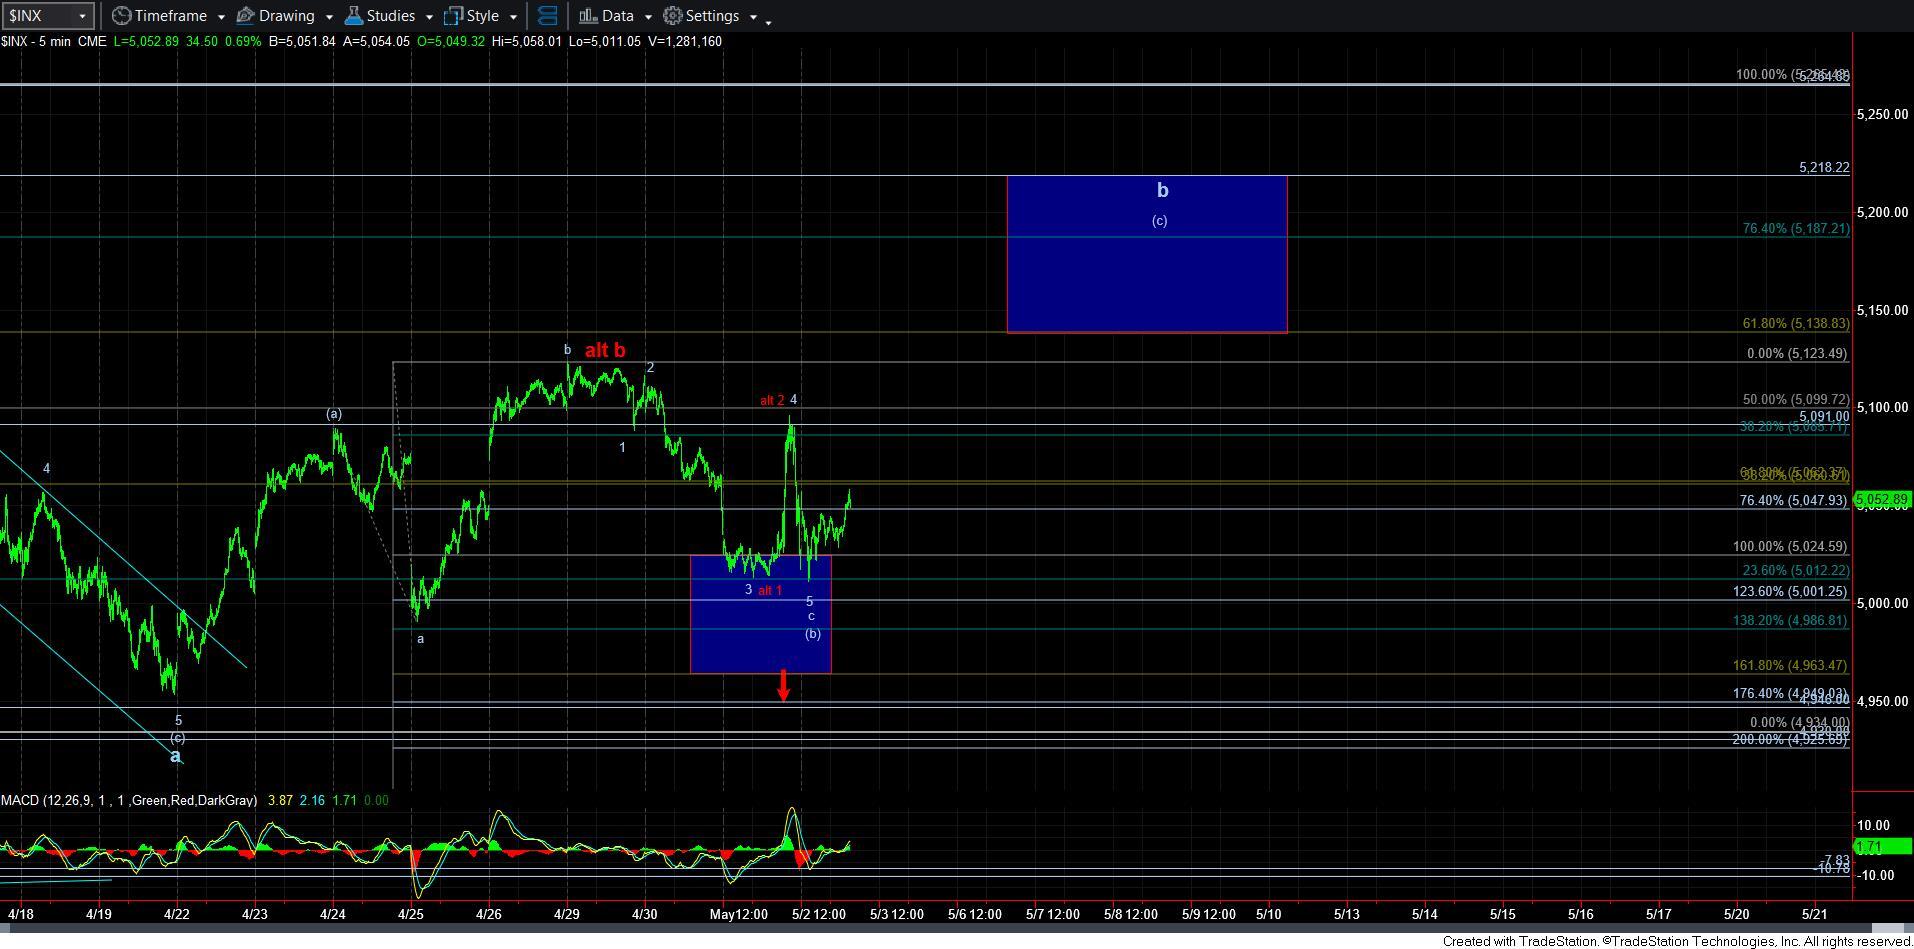
As Mike has been outlining, the smaller degree structure is a bit unclear. And, that is often typical of b-wave or corrective structures. In fact, I can probably outline 4/5 different ways to count the smaller degree structure outlined on the 5-minute SPX chart.
Yet, all my analysis can be summed up by the following statement: As long as the market continues to hold the lower support box on the 5-minute chart, I am going to continue to look higher to test the resistance box overhead.
In the meantime, as least so far, the rally is starting to take shape as a potential [c] wave rally. So, for now, I am still going to look higher.
But, should the market turn down hard from here and break below today's low, and follow through below the support box, then I will likely have to move into the more immediately bearish red count.
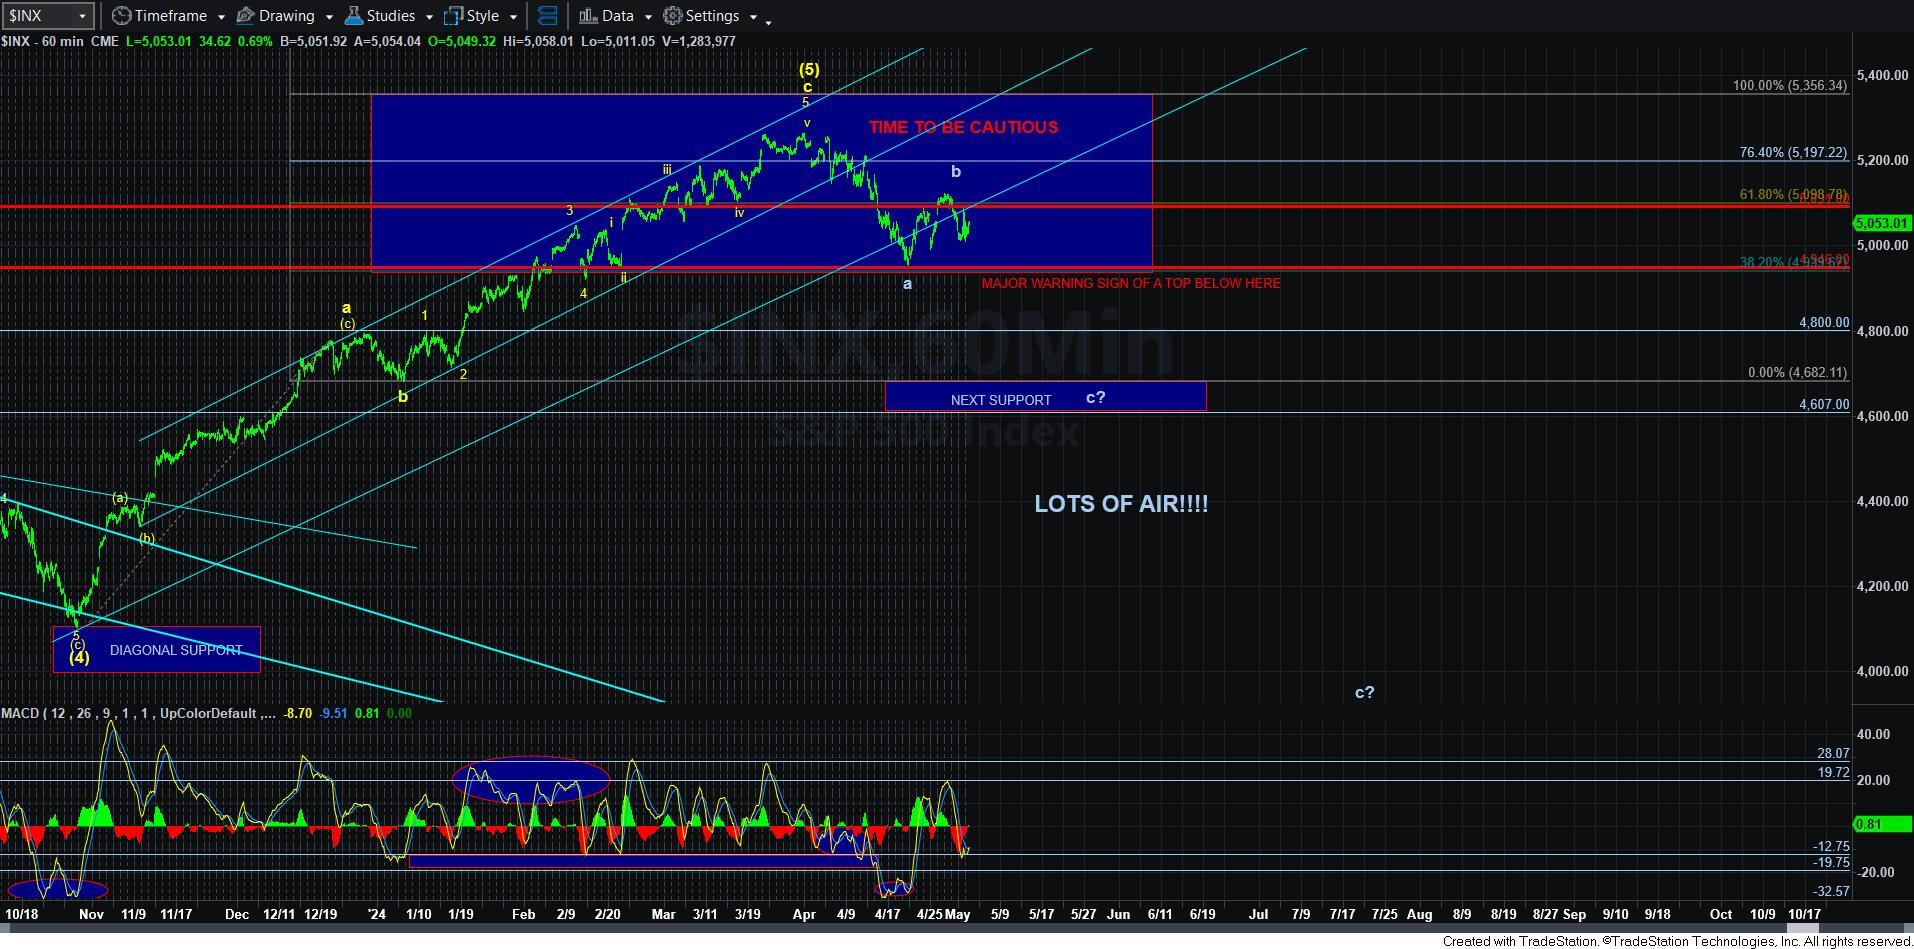
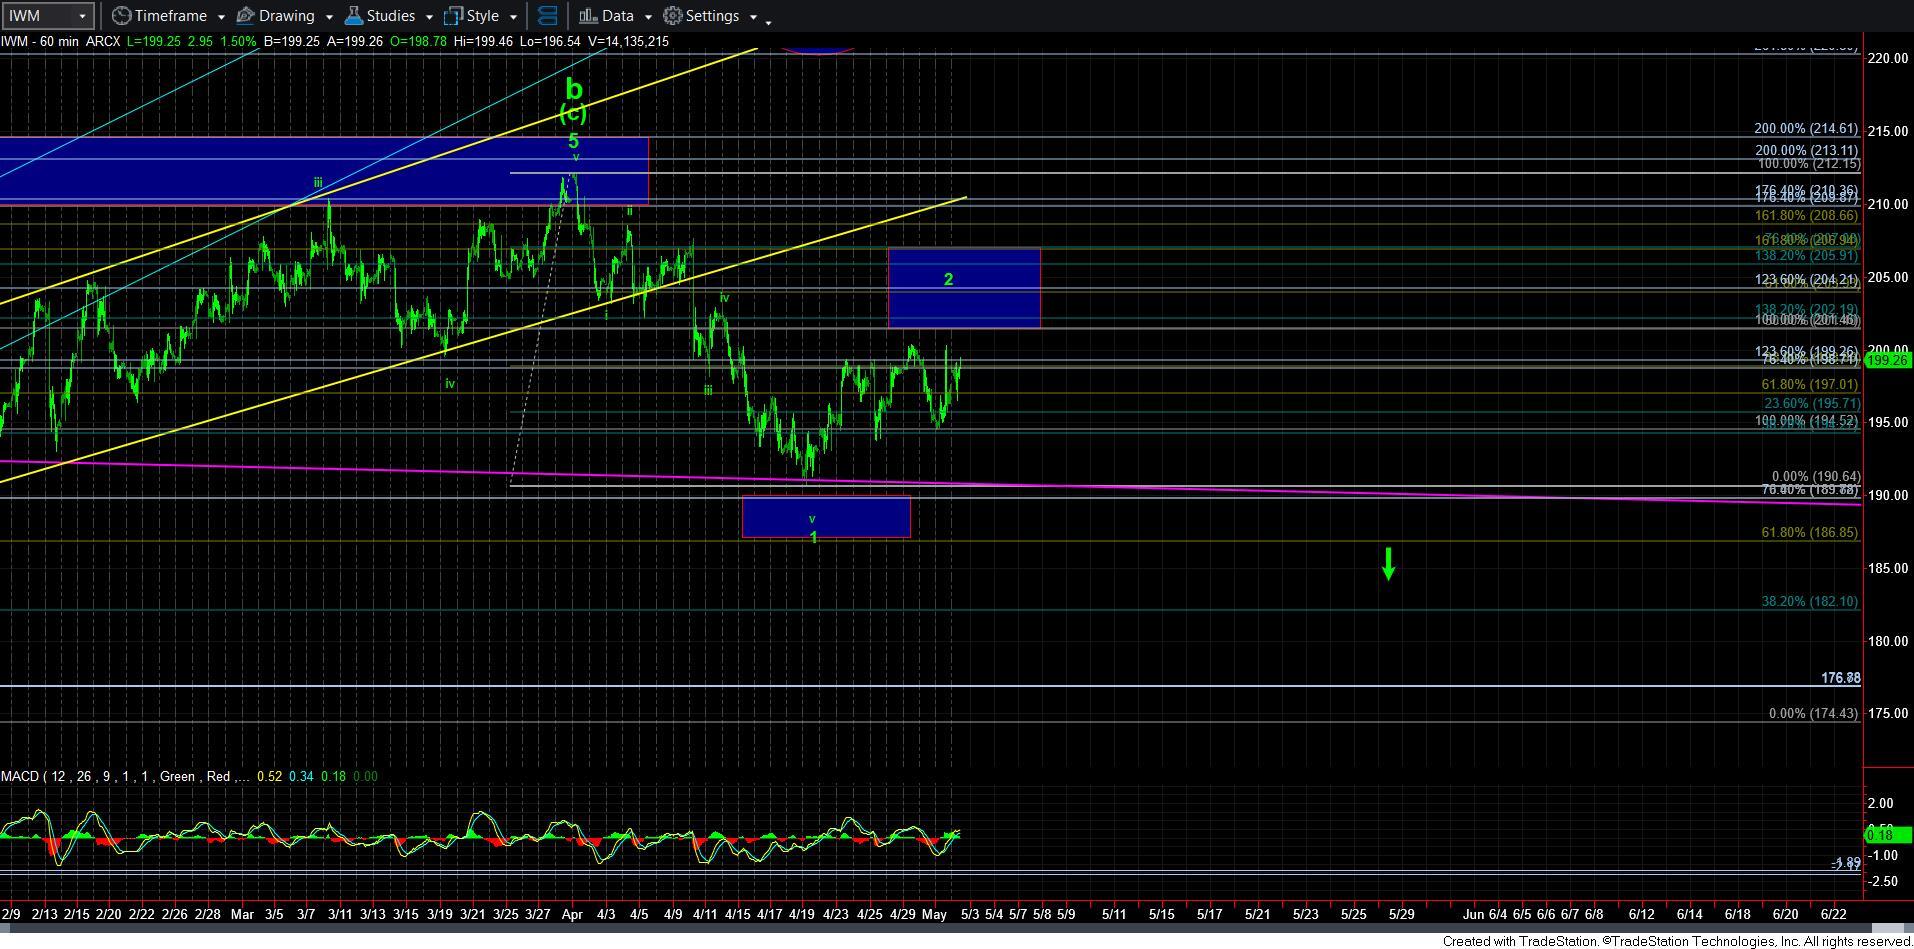
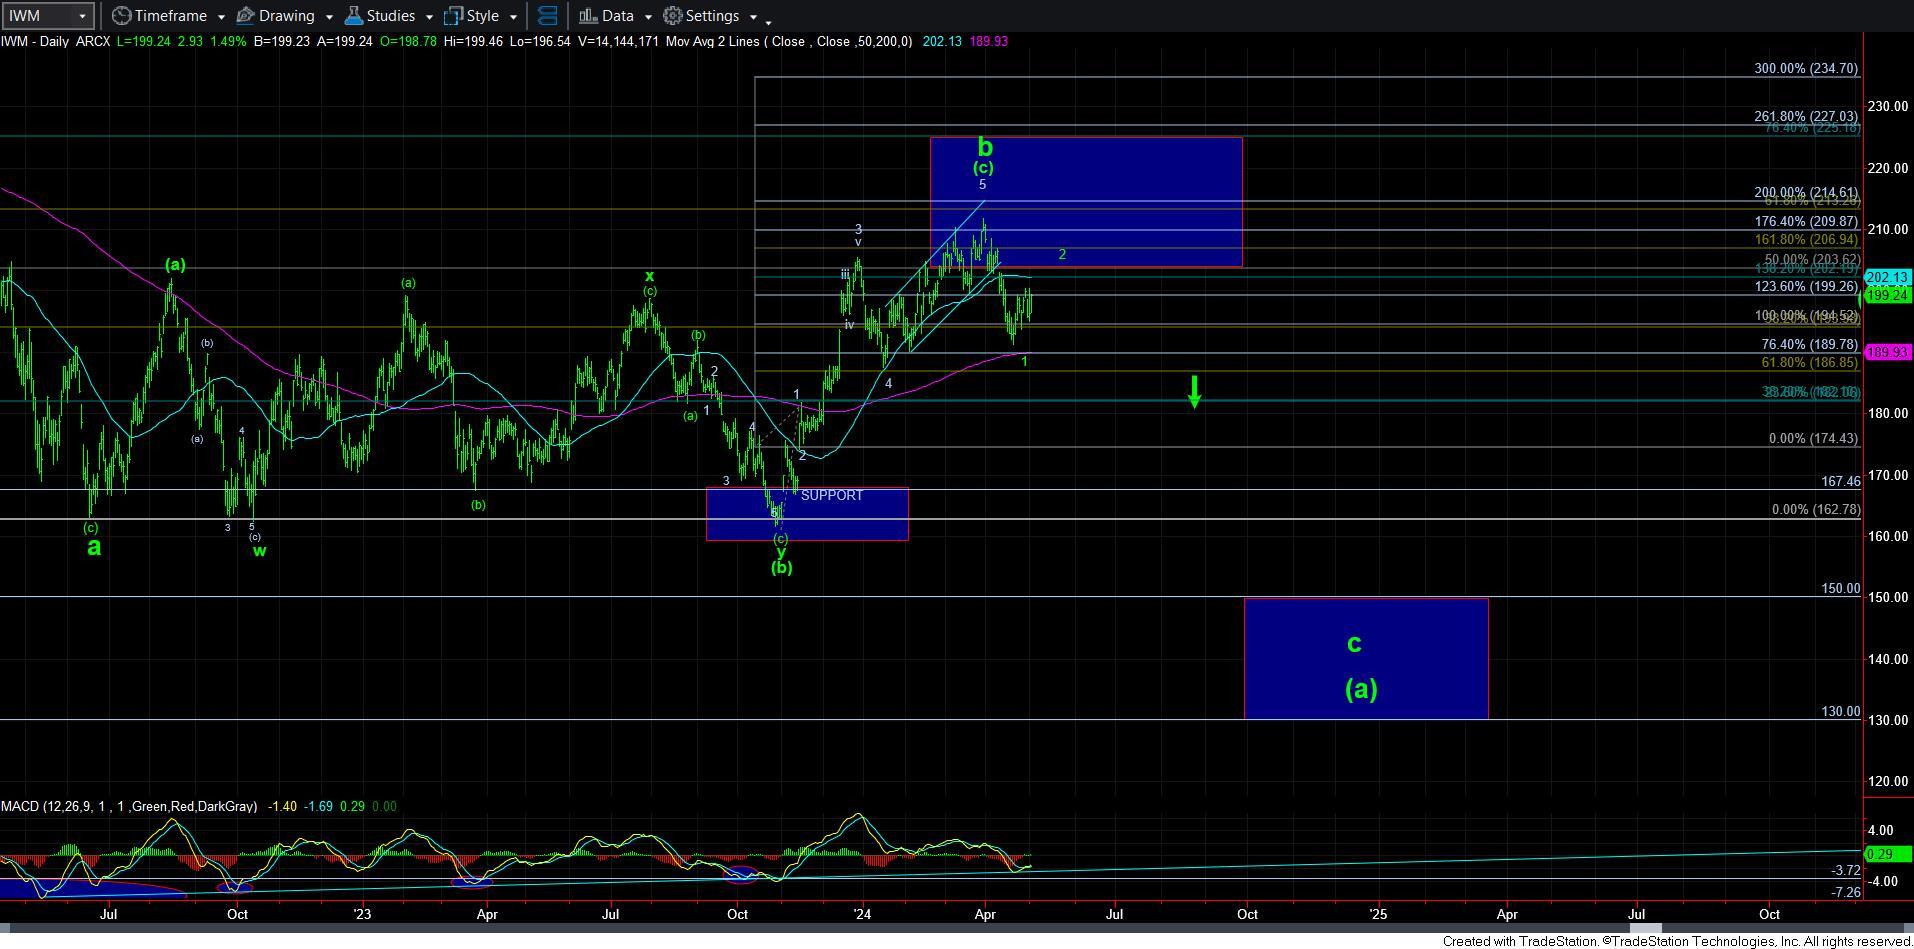
Just to show you the bigger picture as well in IWM, it still has been quite strongly suggestive of us setting up a major decline in the coming weeks. And, I really do not have a reasonably probable altenative that is pointing to higher highs at this time. While I still think we can push a bit higher in the wave 2 rally, I am not really seeing much bullishness evident fro this chart betond that. And, if we begin to start breaking below 193 in a strong impulsive manner, it will likely begin to open that door to the c-wave decline on the daily chart. And, my alternative at that time will be that we are just getting a 5th wave down in wave 1 down. But, I will provide parameters for that potential should we see a more direct break down in the coming days.
So, for now, I think the near term can still push us a bit higher. But, please recognize that this is a relatively bearish structure we seem to be developing at this time.


