Still Chopping Around - Market Analysis for Mar 2nd, 2023
I am going to start with the micro structure presented on the 5-minute chart and then address the broad perspective.
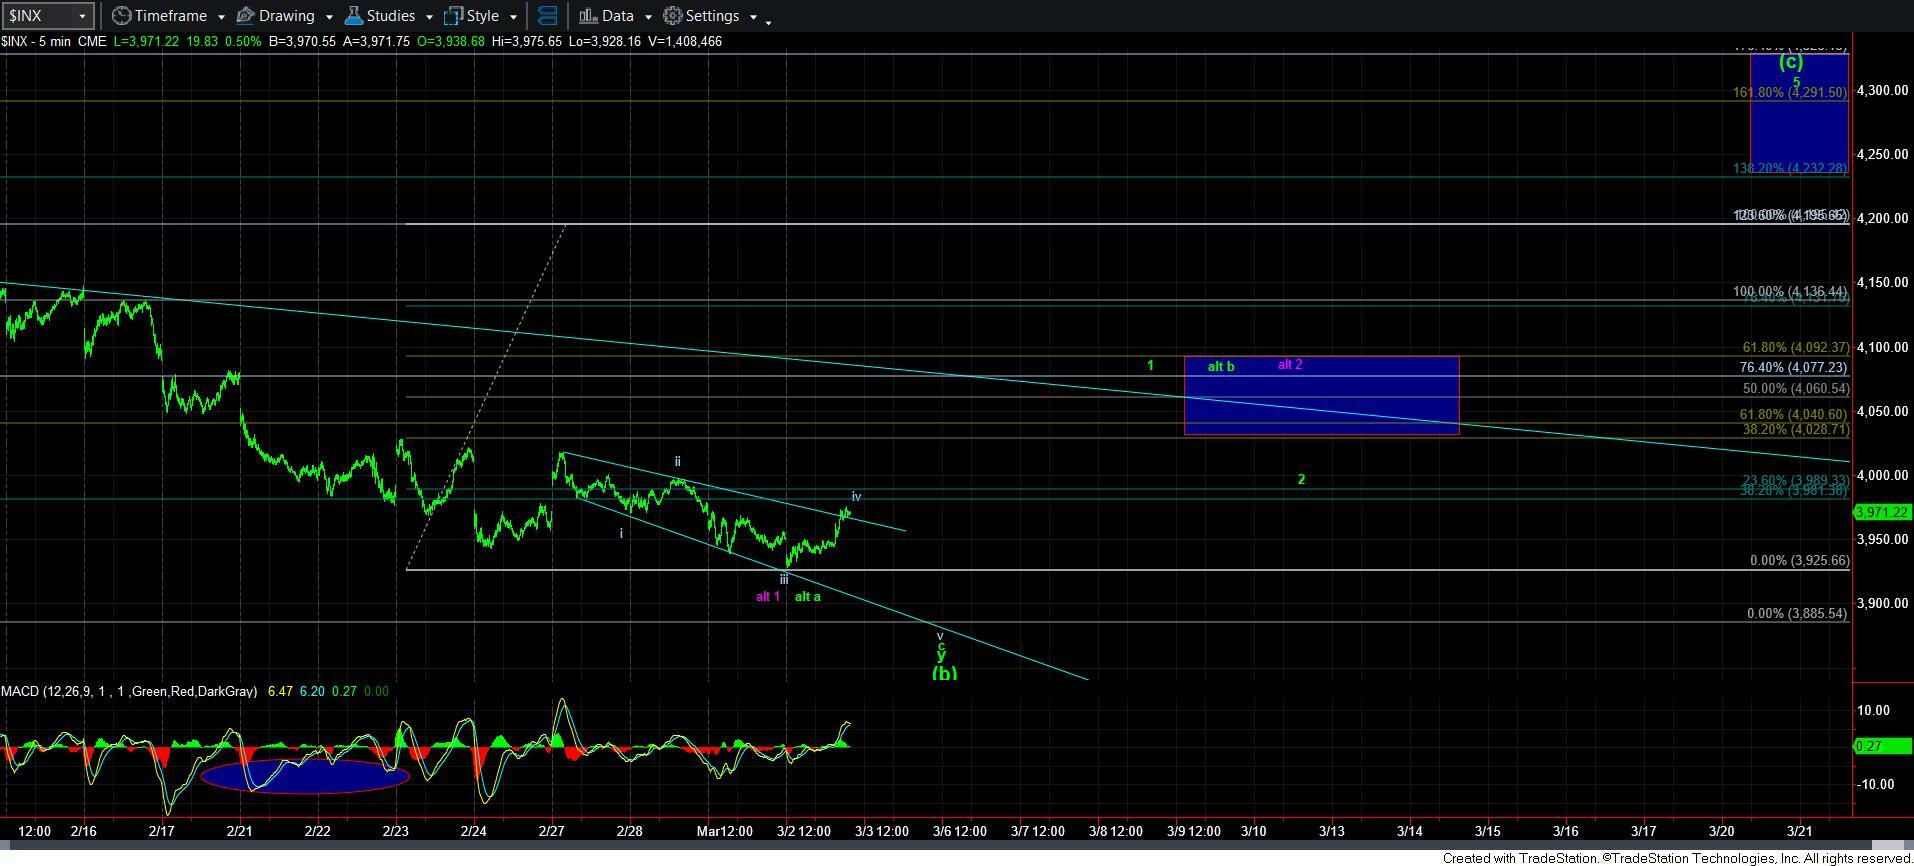
First, as I made clear yesterday, since we broke down below support, I would much rather get closer to the support box on our chart. And, if the market is trying to complete a 5th wave in a c-wave to get us closer to that target, then I have presented an ending diagonal potential structure on the 5-minute SPX chart. This structure would invalidate with a move over wave ii.
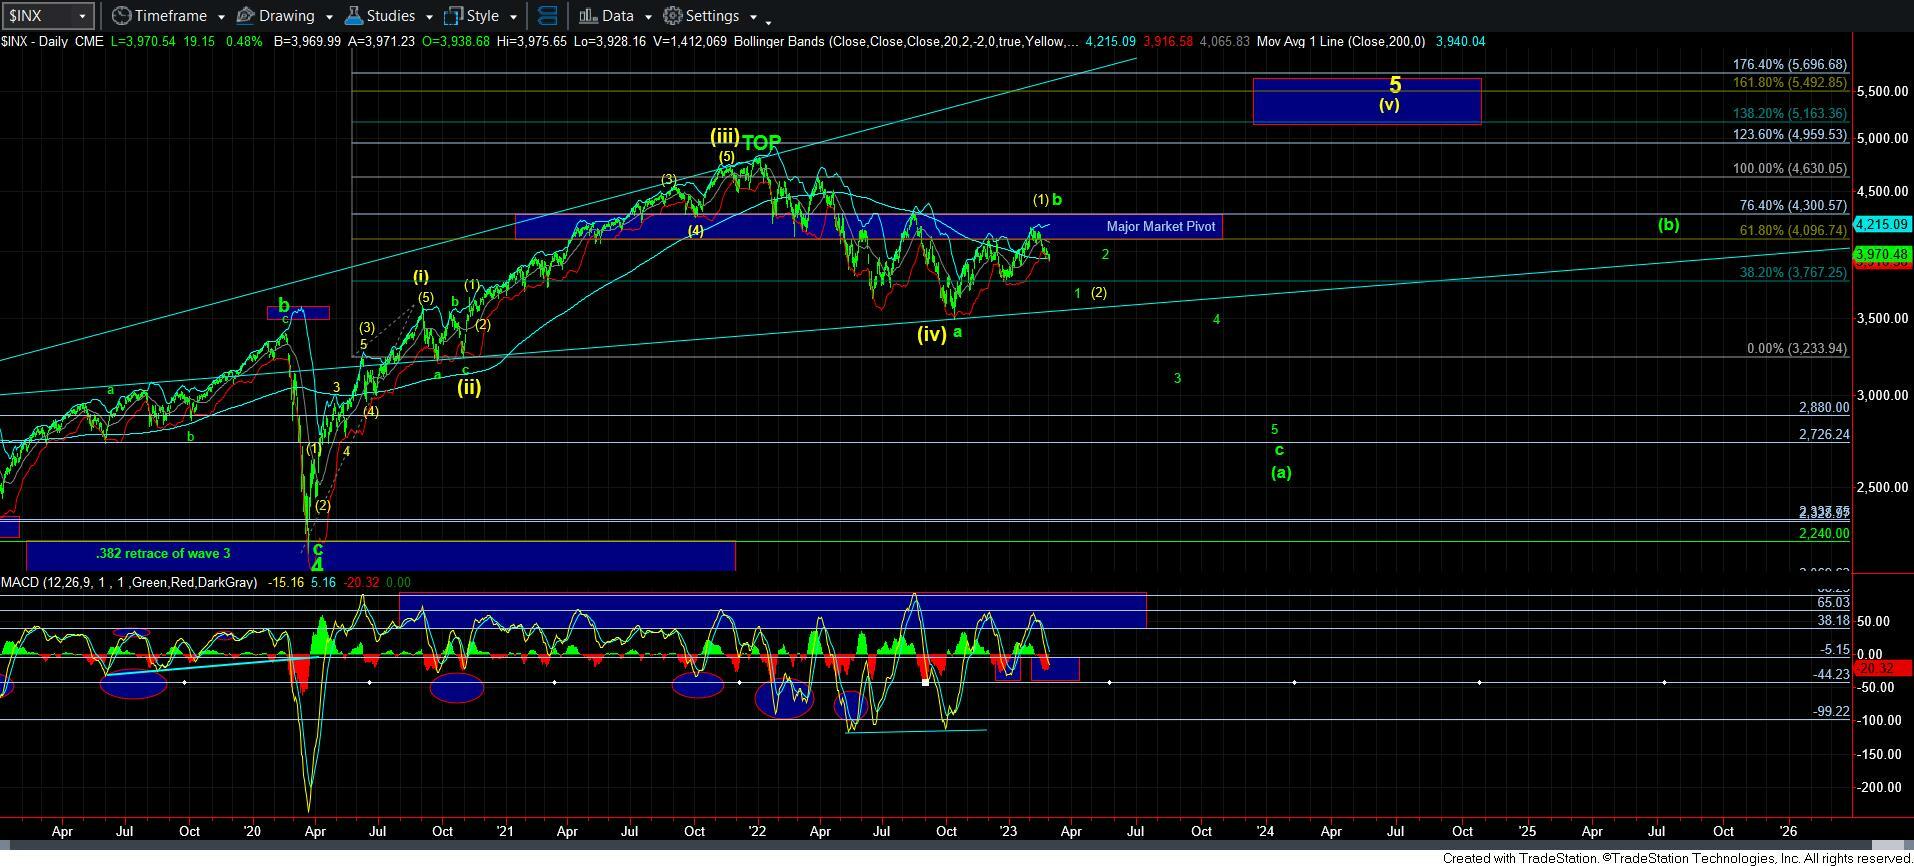
This brings me to the main point. The market has been terribly overlapping with a really unclear structure ever since we topped out in the 4195 region. Moreover, when we look at the indicators, we are still holding many divergences as we continue to “leak” lower and lower during this pullback. Furthermore, the daily MACD is now well within its support region. So, I still think we are dealing with some form of bottoming structure. The questions is what kind?
So, I was going to wait until the weekend to address this, but I decided to write an update earlier today, which was presented in an intra-day alert, and I am going to repeat it here, as well as in the weekend analysis:
I am going to begin discussing the options I am tracking now in the SPX, and will continue into a bit more detail in the weekend update.
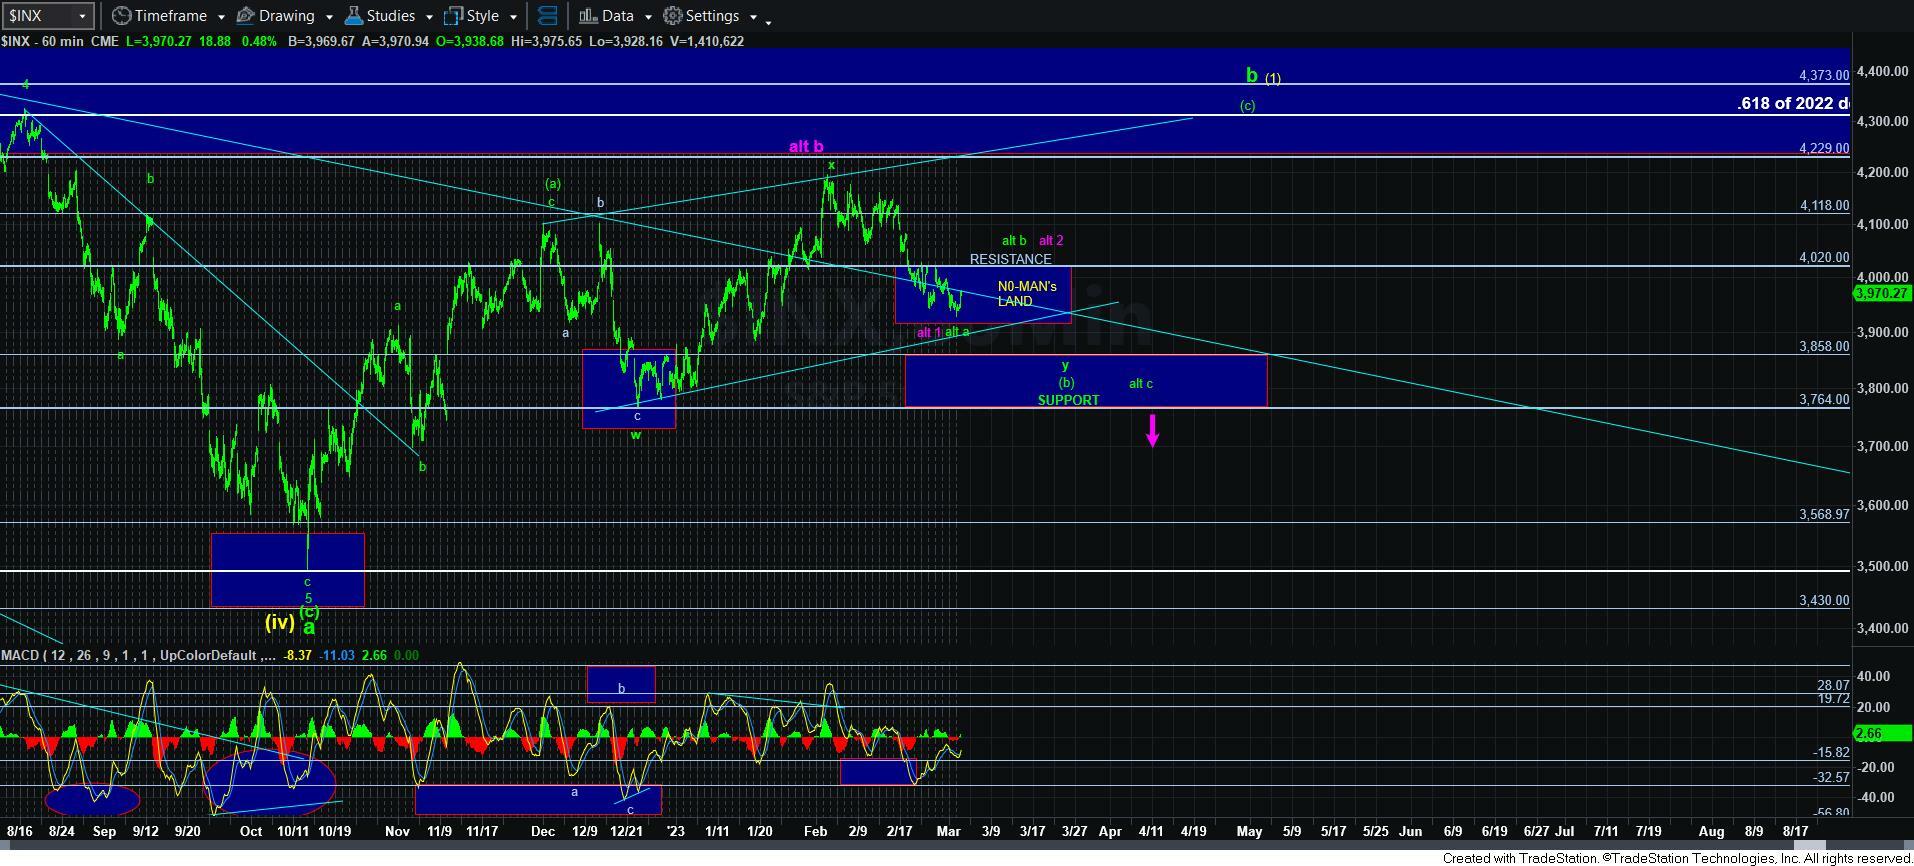
But, for now, I am viewing us in "no-mans-land," as you can see from the attached 60-minute chart. Let me explain why.
If the market bottoms before we get closer to our ideal support region below, we will have to see how it rallies. If it rallies clearly impulsively, then I will assume the y-wave somewhat truncated, and begin to look higher to 4300+.
However, if we bottom before we get closer to our support below, and that rally is clearly corrective in nature, I will likely short that rally under two premises.
First, the primary premise will be that the corrective rally is a b-wave in the y-wave, and it is labeled in green. My target would be the point at which a=c in the support region.
Second, my alternative at that point would be that we are starting a c-wave down in a big way. However, I do not like this perspective for two reasons. First, the high struck at 4195 was no where near a clear 5-wave c-wave, which strongly argues against that being the b-wave high. Second, we did not hit anywhere near standard ratios between that b-wave rally. And, 3rd, we did not hit even a minimum retracement target for that b-wave.
Yet, I cannot ignore the environment within which we find ourselves, so as I said above, a corrective rally that takes shape will have me short for two reasons. And, it will also have me have two targets. The first being the support box. And, if we see what develops as a CLEAR 5-wave c-wave into the a=c target within that support box, then I will be cashing in all my first position short targets, and may even consider cashing in a good chunk of the 2nd position targets that I would have held for a potential purple c-wave down.
So, as you can see, I am going to be taking this one step at a time, and listening to the market as to how we resolve this "no-man's-land." It will take some time, so please be patience.
My preference though would be to see a direct drop to the support region below, followed by an impulsive rally off support. Yet, I am not seeing potential for us to extend that low, therefore, I am preparing alternatives right now. I know this is complex and not easy, but we can only plan with what the market gives us.
Lastly, I will add that Bayesian probabilities are starting to swing towards the potential rally to 4300+”.