Still Cause For Some ‘Concern’
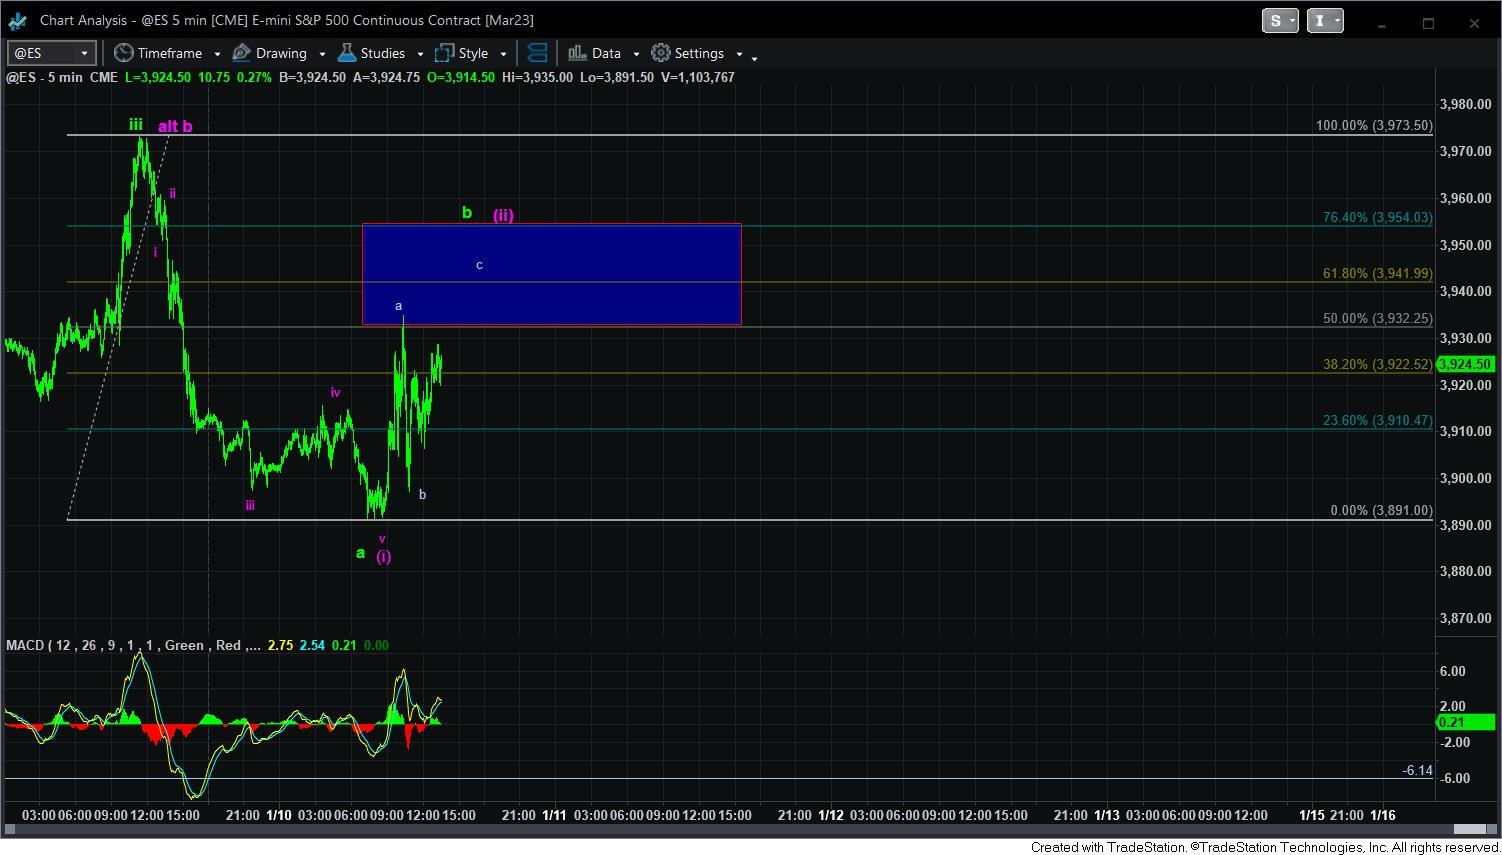
Well, the market went ahead and did it. Yup. It gave us a potential 5 wave decline structure off yesterday’s high. Of course, that can be an a-wave, as some a-waves are 5-wave structures. But, with a 5-wave decline off yesterday’s high in place, it certainly raises the caution flag.
Yet, while I am not including the chart in this update, I am going to watch the IWM/RTY carefully, as it is close to invalidating a potential 1-2 downside. Should it take out yesterday’s high, it would make the decline seen in SPX more likely the a-wave rather than something more bearish, such as the purple count.
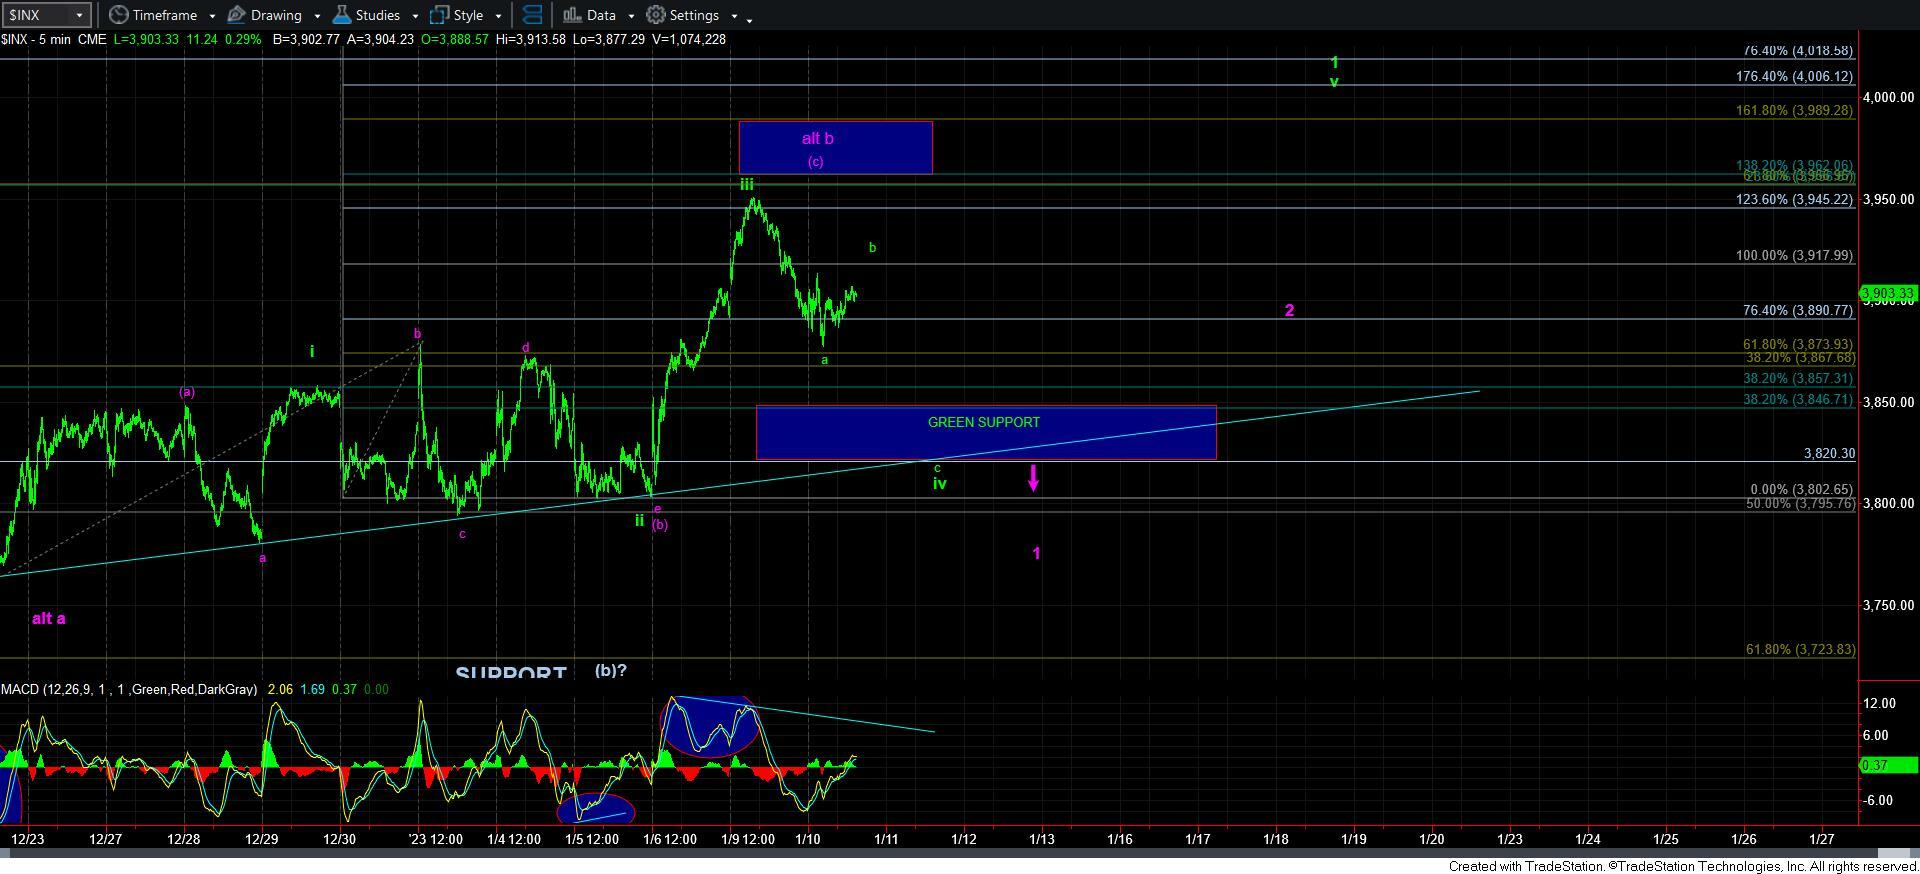
So, for now, I have added the resistance box on the ES chart. And, as long as we hold that resistance, I am looking for another decline which may just be the c-wave of wave iv in green. I have also slightly adjusted the support box for the green count a bit lower, to align with the current wave structure. As long as we hold that support box, then I can reasonably look for a 5th wave higher high to complete a leading diagonal in the 4000 region.
We would need a larger degree 5-wave decline below the support box on the SPX to suggest we are setting up a 1-2 downside structure for the purple count, pointing us to the 3600SPX region. And, we are not there yet.
In the meantime, I am going to include an alert I wrote earlier today, which sums up our current posture in the market:
“Time for a bigger picture update, so you can take a step back from the minutiae.
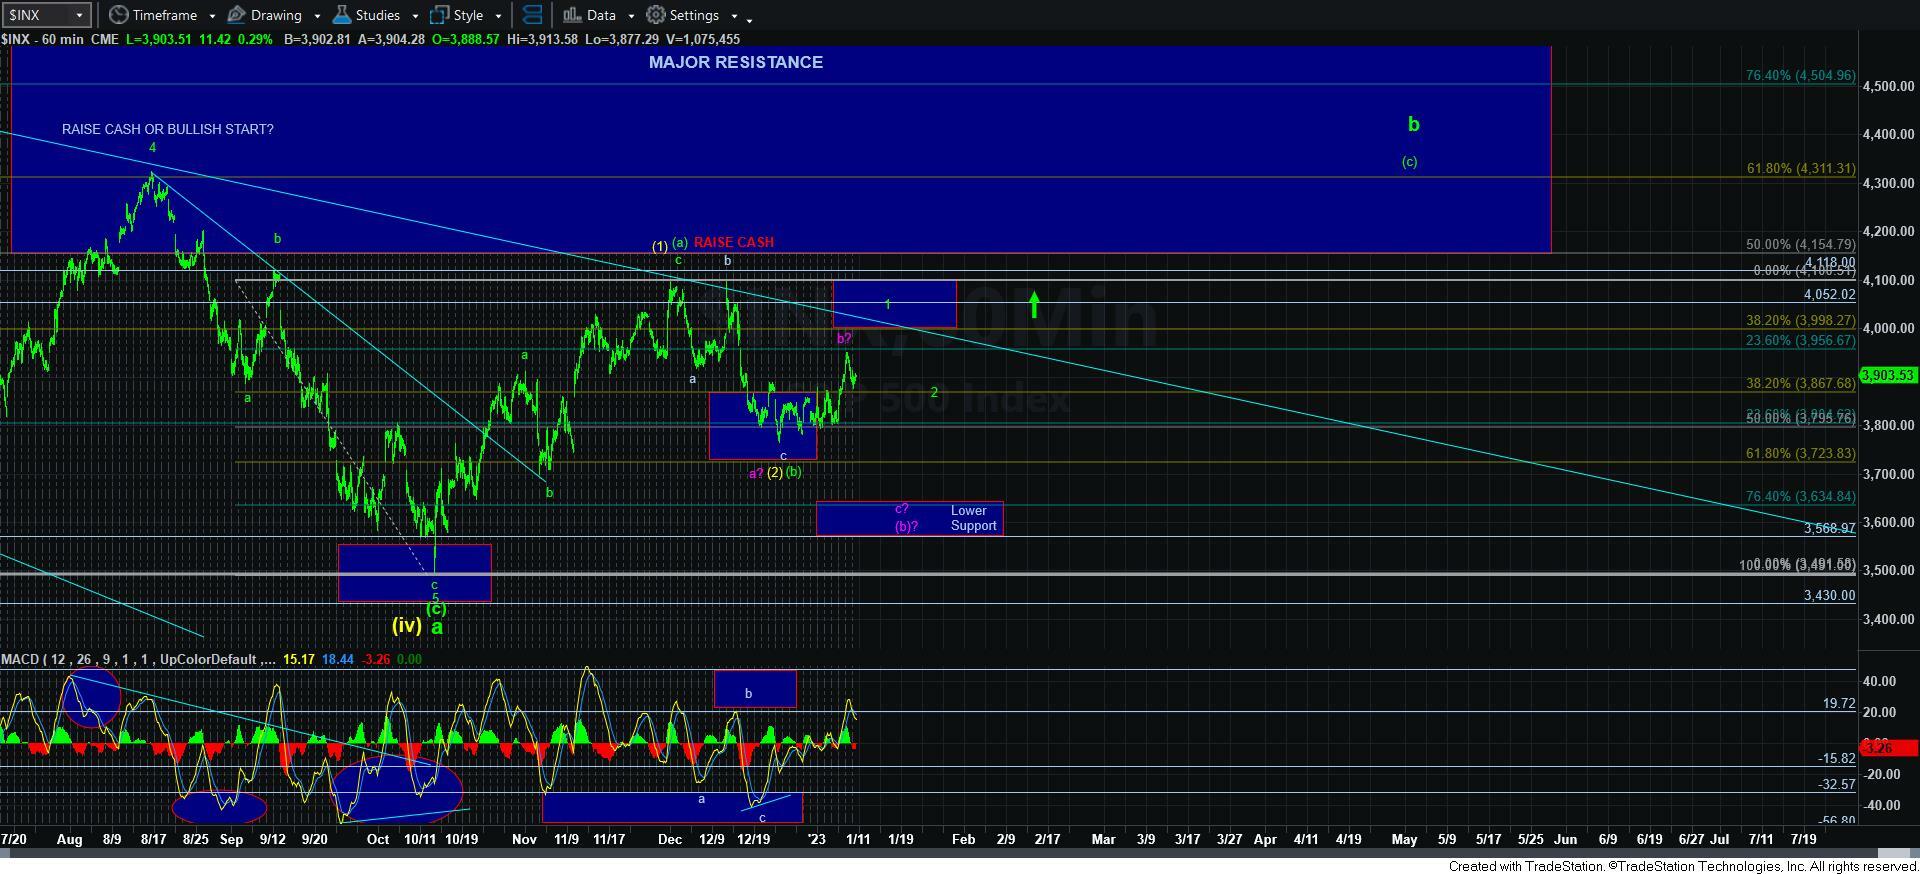
I am still tracking the potential for a rally to 4300+. Have we begun that rally? Well, the only way that it will happen is if wave 1 takes shape as a leading diagonal. And, that is not the most trustworthy of trading cues. So, I not only need to see AT LEAST one more push higher to take us to the 4000SPX region to complete wave 1, I will need to see a corrective wave 2 pullback thereafter, followed by an impulsive 5-wave move off that wave 2 low to give us wave i of 3 of the [c] wave to begin to trade for that [c] wave rally.
Until that happens, the market has put us in a more precarious posture, with the potential for a deeper [b] wave, which will remain on the chart as a reasonable probability as long as we remain below yesterday's high. And, should we break down below the green support box on the 5-minute SPX chart, then it increases that potential that we will drop to the 3600SPX region in a deeper (b) wave, as presented in purple.
Clearly, this is going to be a very important resolution in this region over the coming week.”