Still Approaching The Market Cautiously – But, The Follow Through Could Be Significant
 By
Avi Gilburt
When a market provides us with an initial decline off an all-time high, and the structure is overlapping, such as the one with which we have been dealing since early October, then it often clouds the specific wave count in the initial move down.
Moreover, as the market has yet to invalidate the green count as shown, I am still forced to approach my analysis cautiously without becoming too bearish until this potential bullish structure actually invalidates. So, while I have been outlining my skepticism for the green count, I cannot completely disrespect the potential, especially based upon how strong this bull market has been for quite some time.
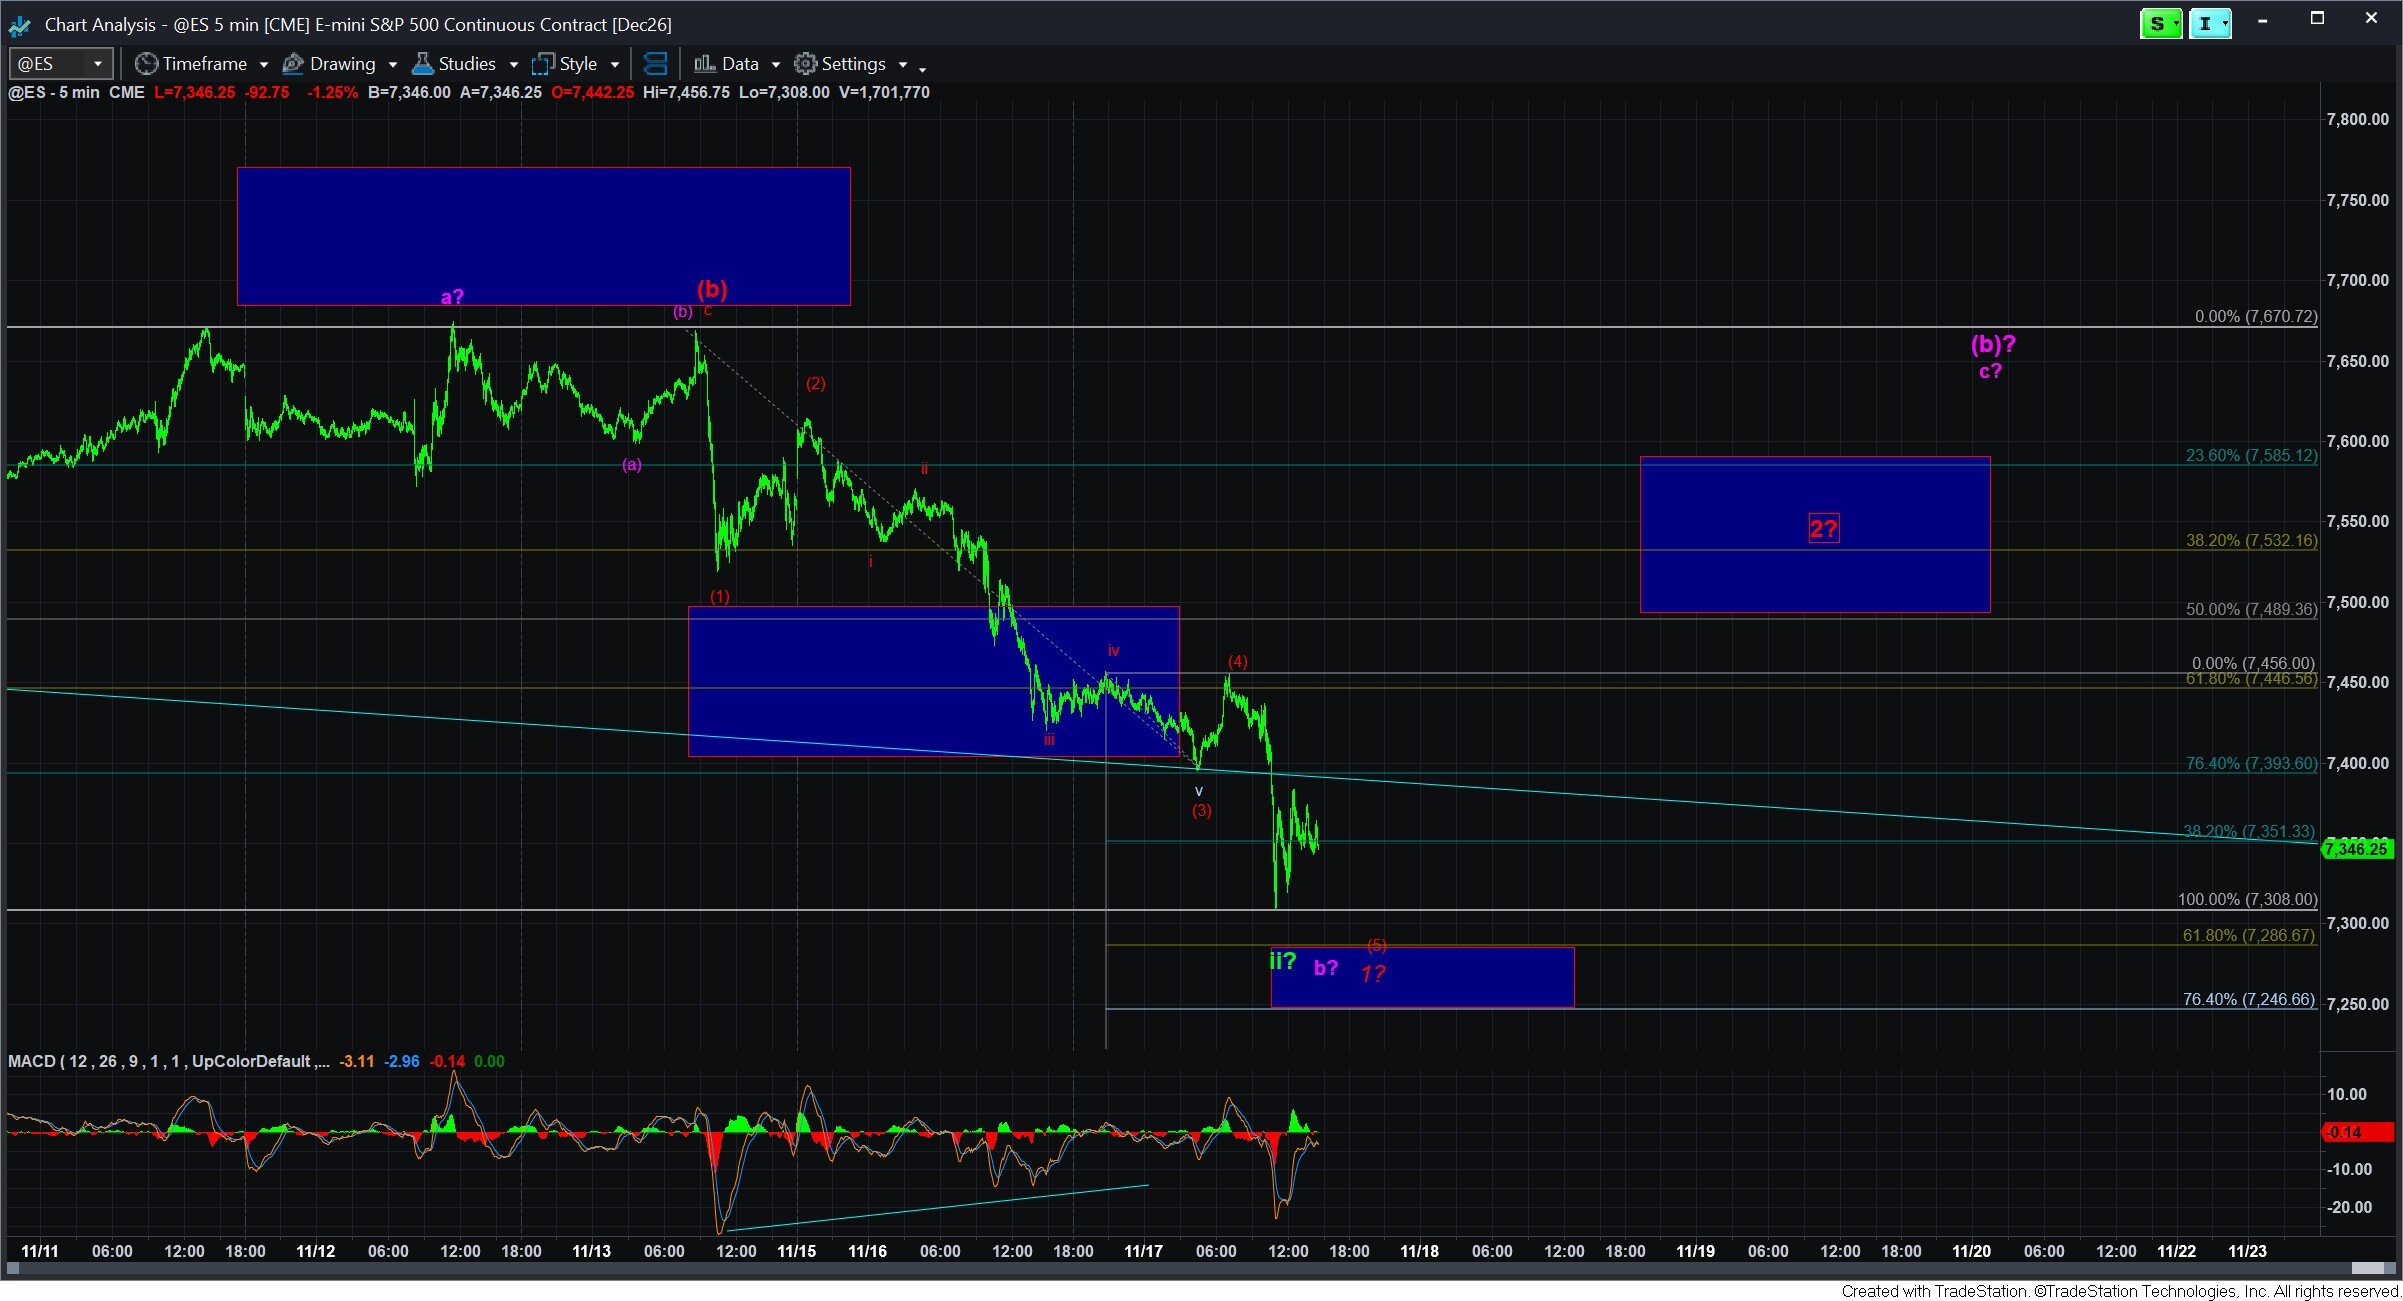
While it was not clearly evident during the week (and even in hind-sight I don’t think it is clearly evident), we may be completing a 5-wave decline from the high struck at the end of last week. The reason it is not clearly evident is that I was unable to identify a clear 5-wave decline in the first spike down from this past Friday’s high. But, with the current action, we may be forced to look at it at like this.
If you look at the attached 5-minute ES chat, I have added a support box below us which represents the point at which a wave (5) would be equal to .618-.764 the size of waves (1)-(3). And, as I have explained before, if we break below that support, then the decline is no longer a 5th wave, but potentially something else.
For now, I am going to expect that this support will hold, and, assuming it does, then our next expectation is to see a rally.
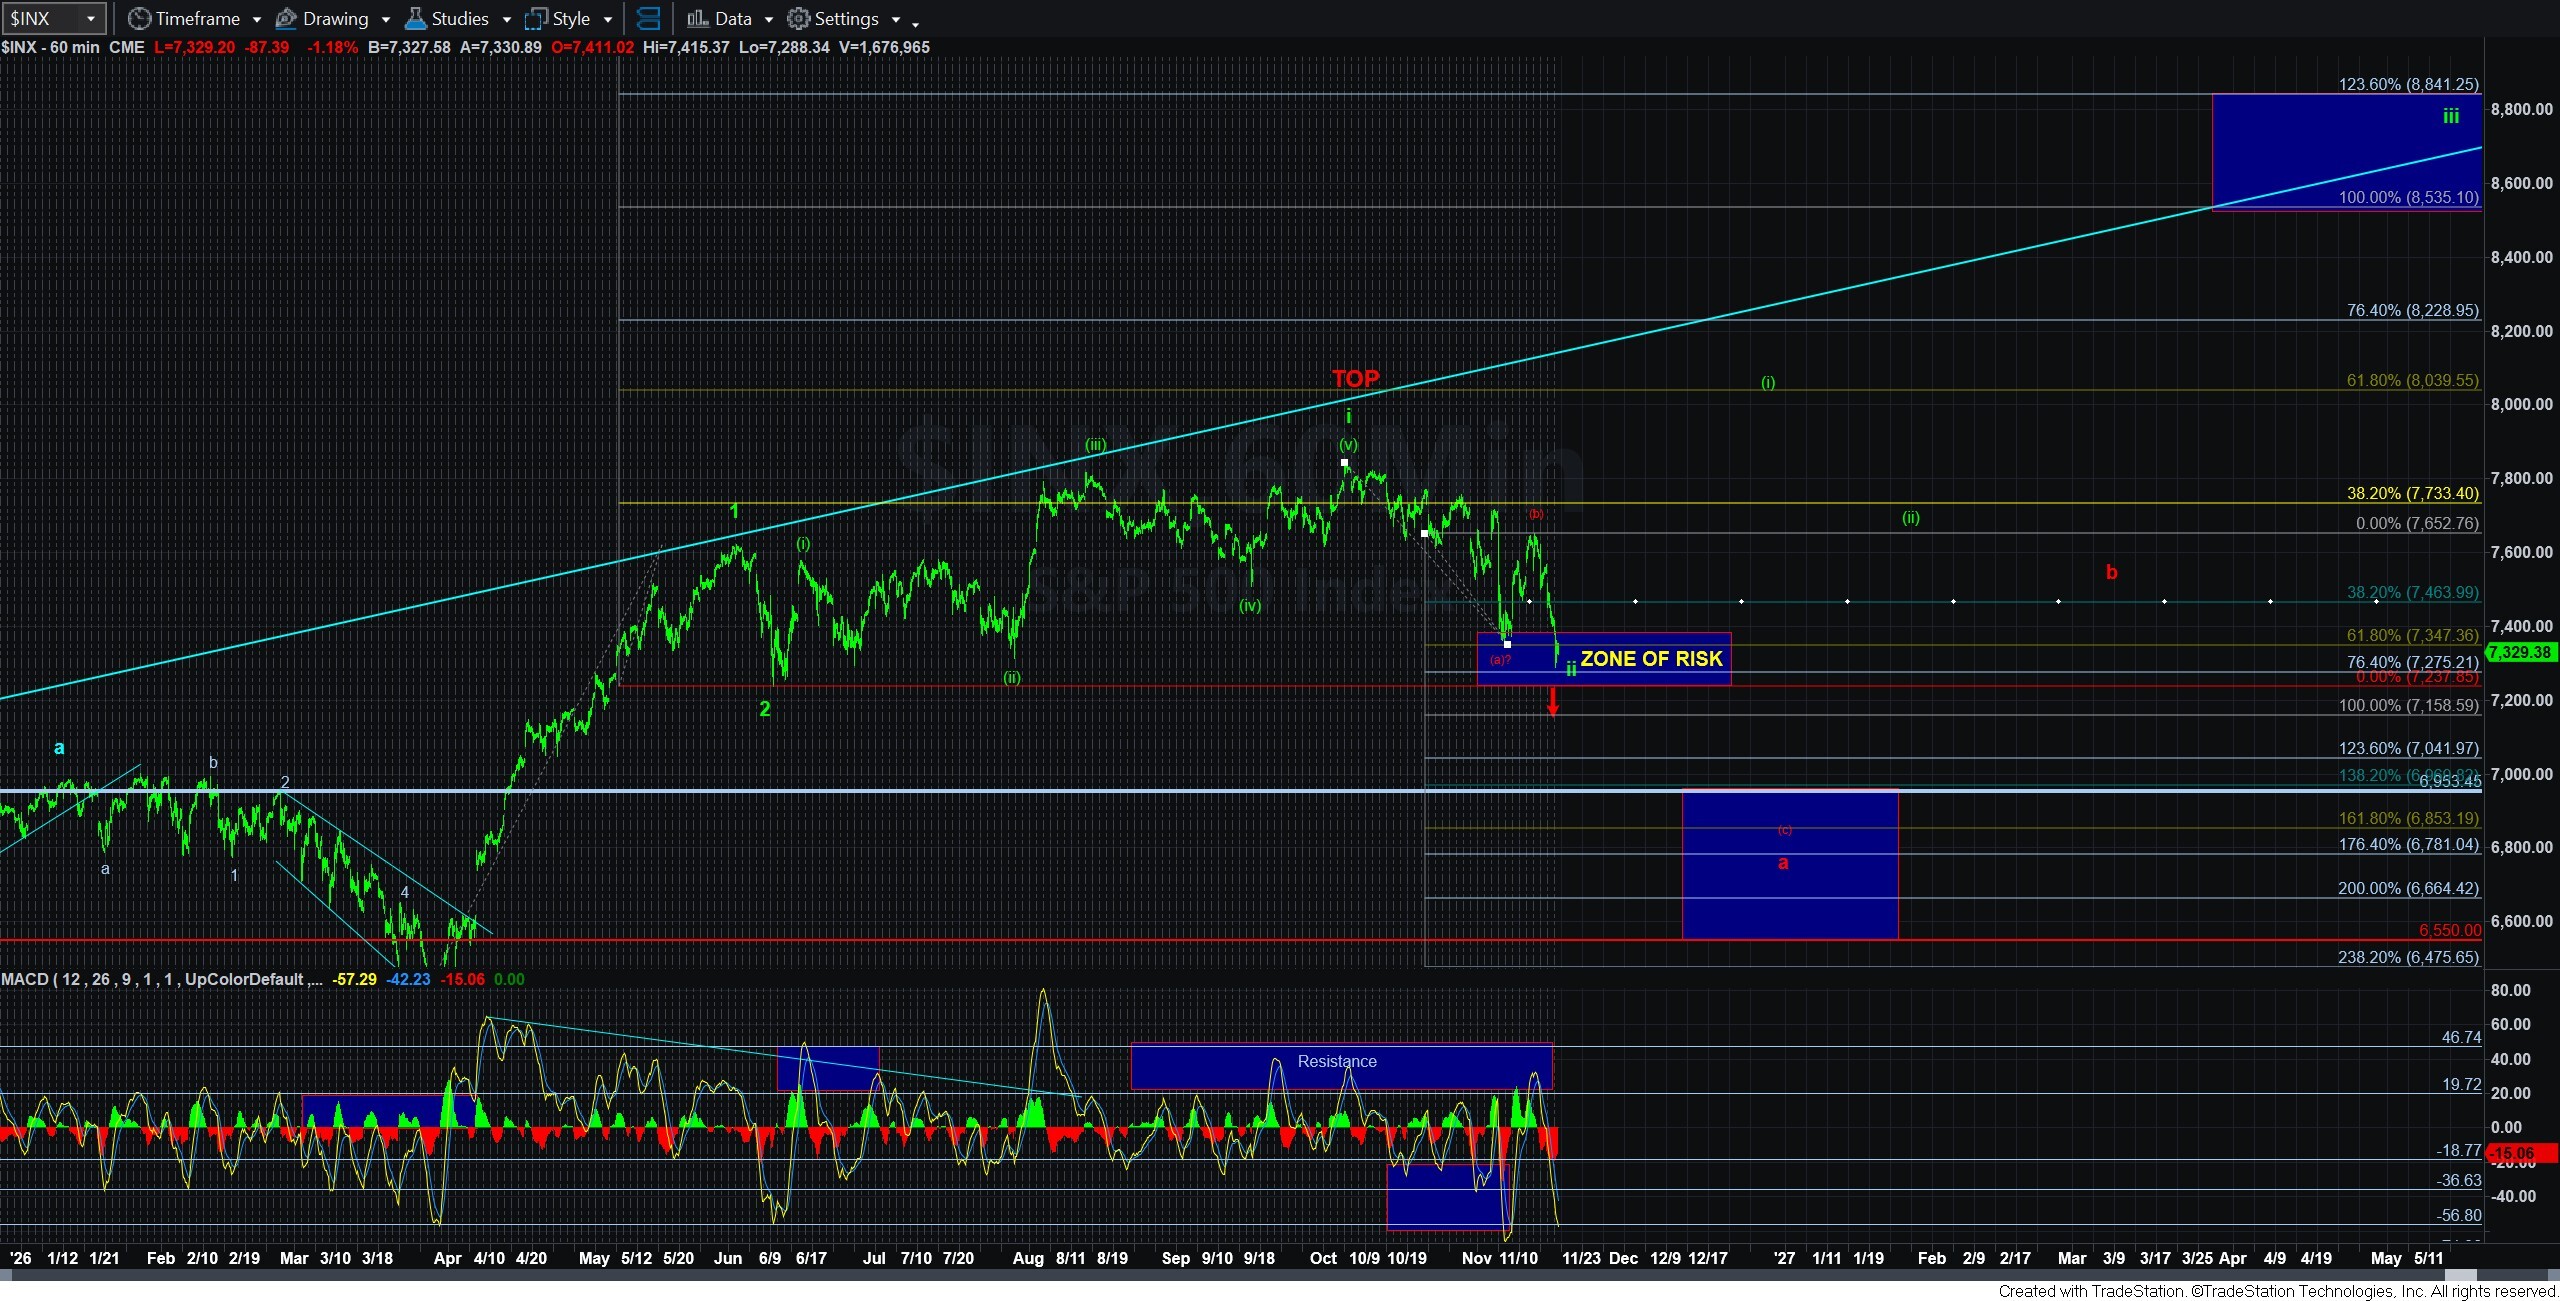
Again, I am leaving that green wave ii bottom in place simply because we have yet to break down below 7237SPX. But, as I have said numerous times, the market is going to have a lot to do to prove that potential.
Therefore, I think the most likely scenario is that we are developing a bigger 1-2 downside structure for a larger degree (c) wave decline – red count, or we are going to get a bigger (b) wave take hold – purple count, which will then set up a (c) wave decline.
I have also adjusted my support box on the 60-minute chart to the ultimate target I would expect if we are developing a 1-2 structure for the (c) wave decline per the red count. We will have to see how high the wave 2 takes us and then begin projections as to the highest probability target for the (c) wave of a bigger a-wave, as presented on the 60-minute chart.
Unfortunately, I am not sure how the market is yet going to set up to head lower, but if the next rally is clearly corrective, then I am probably going to stand by the red 1-2 downside set up. If the market should rally in an impulsive manner, then I am going to have to view the top of high struck last Thursday as the a-wave high which means that we are completing the purple b-wave and the initial 5-wave structure off a low here is the wave 1 of the c-wave of a bigger (b) wave in purple.
So, this is likely to remain complex for a bit longer. But, unless the market is able to prove to us a more bullish intention through the green count, I am going to be viewing the downside set ups as primary.
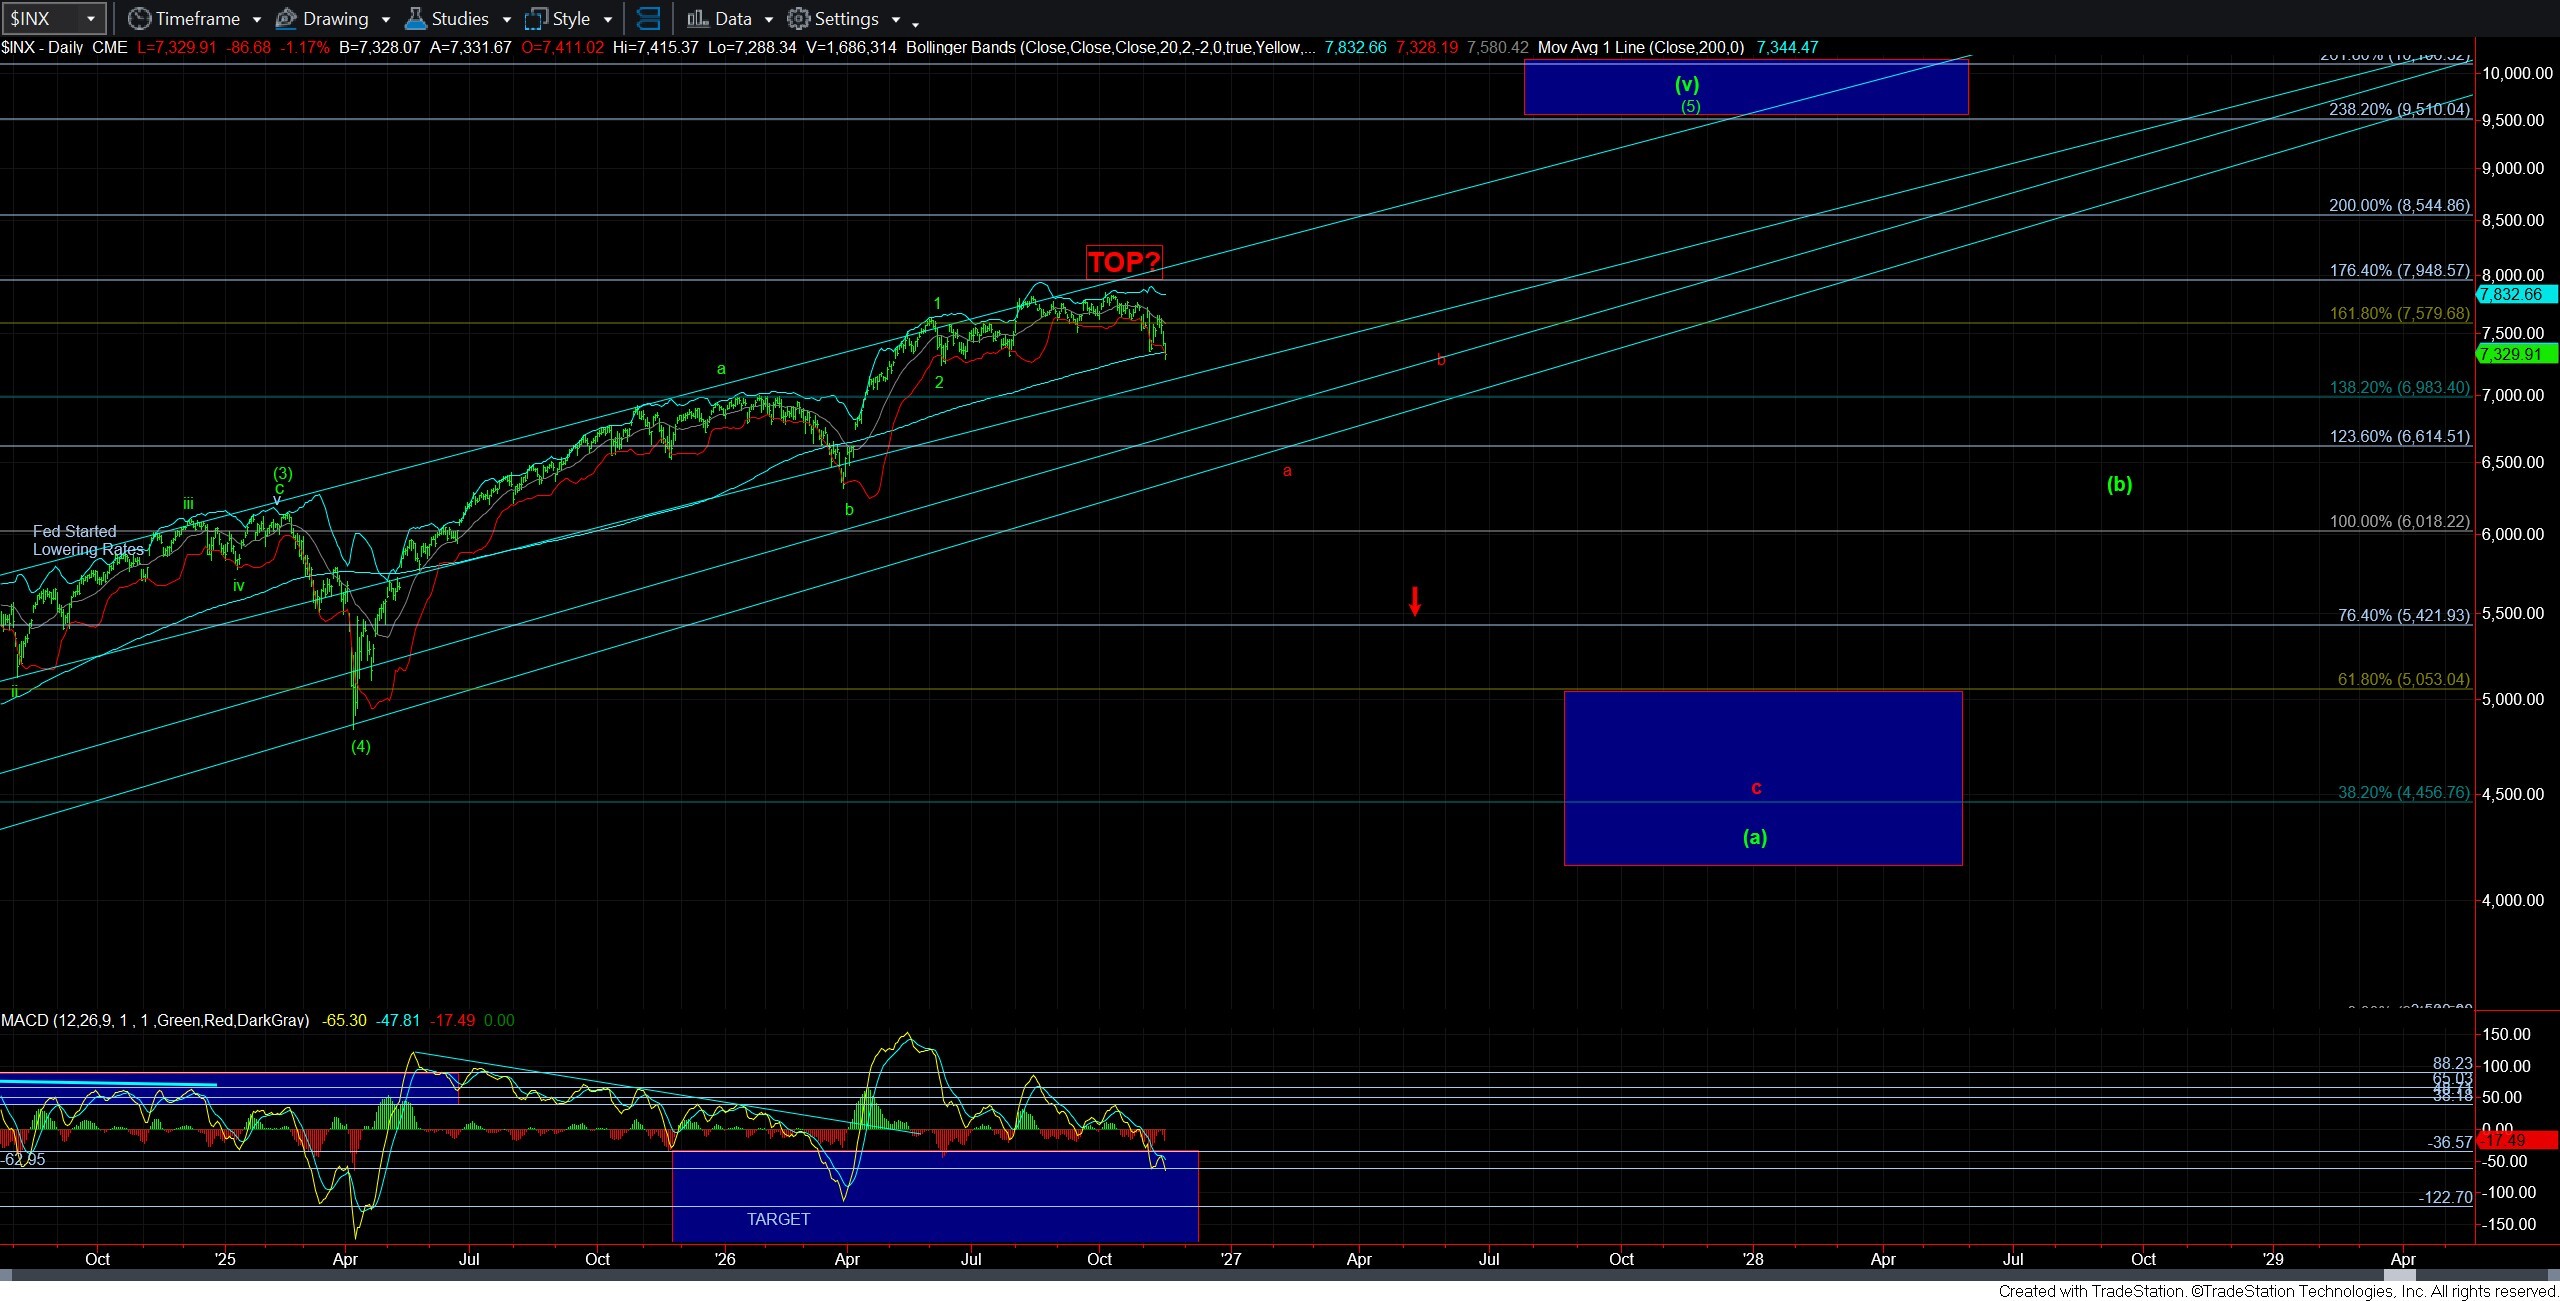
Also, in the bigger picture, please recognize that, should we break below 7237SPX, I will be viewing all bounces as corrective, and then leading to lower levels UNLESS and UNTIL the market gives me a CLEAR larger degree 5-wave structure which would warn me that a move to higher highs may yet be seen. In other words, I will be approaching the market from a perspective that a bearish path is being carved out, with potential that the long-term top has been struck.
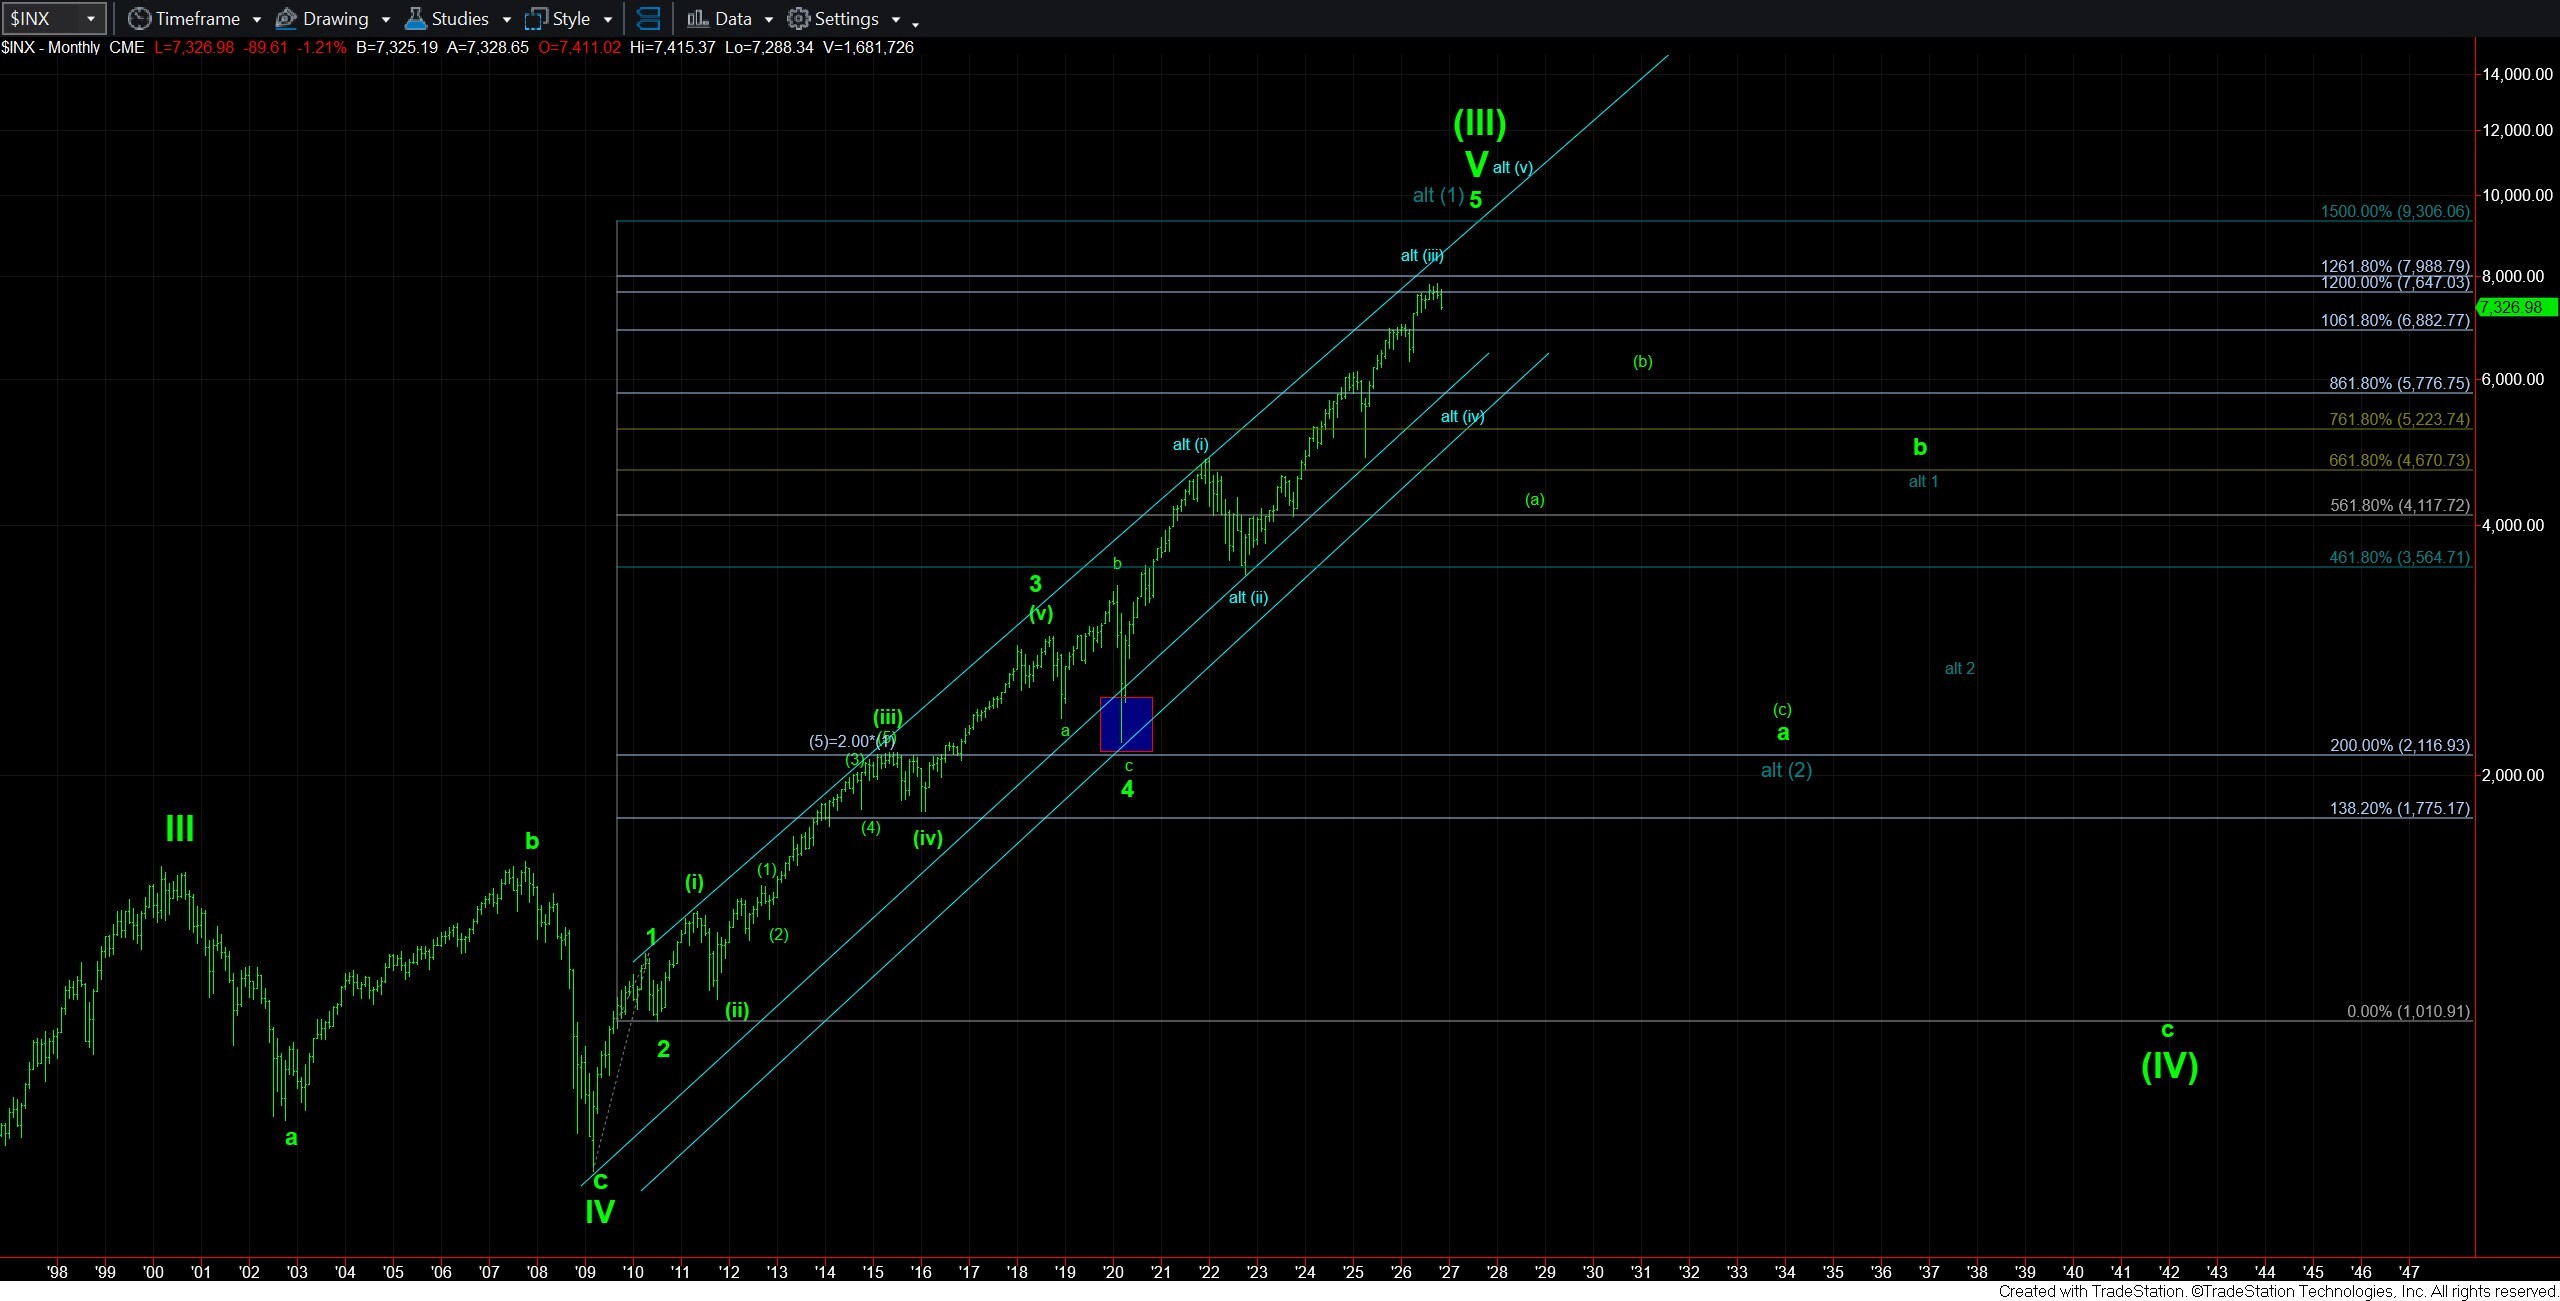
Also, keep in mind something I have said a few times over the last month or so. Since the market did not reverse off the highs in the normal manner in which we see the market react once an ending diagonal completes, I have to keep the potential for a higher high in the back of my mind as per the blue count on the monthly SPX chart. This is why I cannot confidently state -with a very high probability view - that the bear market has begun once we break 7237SX. But, I will be approaching my analysis as though the bear market has begun with a break down below 7237SPX. Yet, if I see evidence that the blue count may be playing out, I will alert you to that potential. But, it is something we will be forced to consider especially if we drop as deep as the 5000SPX region in the coming weeks and months.
In summary, as long as the market does not give us any reasons to view the green count as a high probability from this point forth, I will be approaching all bounces as set ups to take us lower, and potentially down towards the 5000SPX region in the coming months.