Steps The Market Needs To Confirm A Bottom After Taking The Open Door To New Lows
 By
By
Today we saw the market push to new lows once again after seeing a corrective move higher yesterday right into the overhead resistance zone. So while we did have a potentially full pattern into the lows at yesterday's close the fact that we still only had three up off of those lows and were trading under resistance made it more likely that another lower low would be seen before an ultimate bottom was struck. Interestingly, however, was the divergence that was building in the Volatility markets in that I was seeing a pattern that was more suggestive of the market bottoming rather than accelerating sharply lower. Today while we did see another lower low in the equity markets the Volatility charts did not see a higher high thereby maintaining the divergence that had formed yesterday at the close. I will continue to monitor all of the equity charts as well as the Volitiy charts over the next several days as I am viewing what is happening in the Volatility markets as telling here as we move towards the weekend.
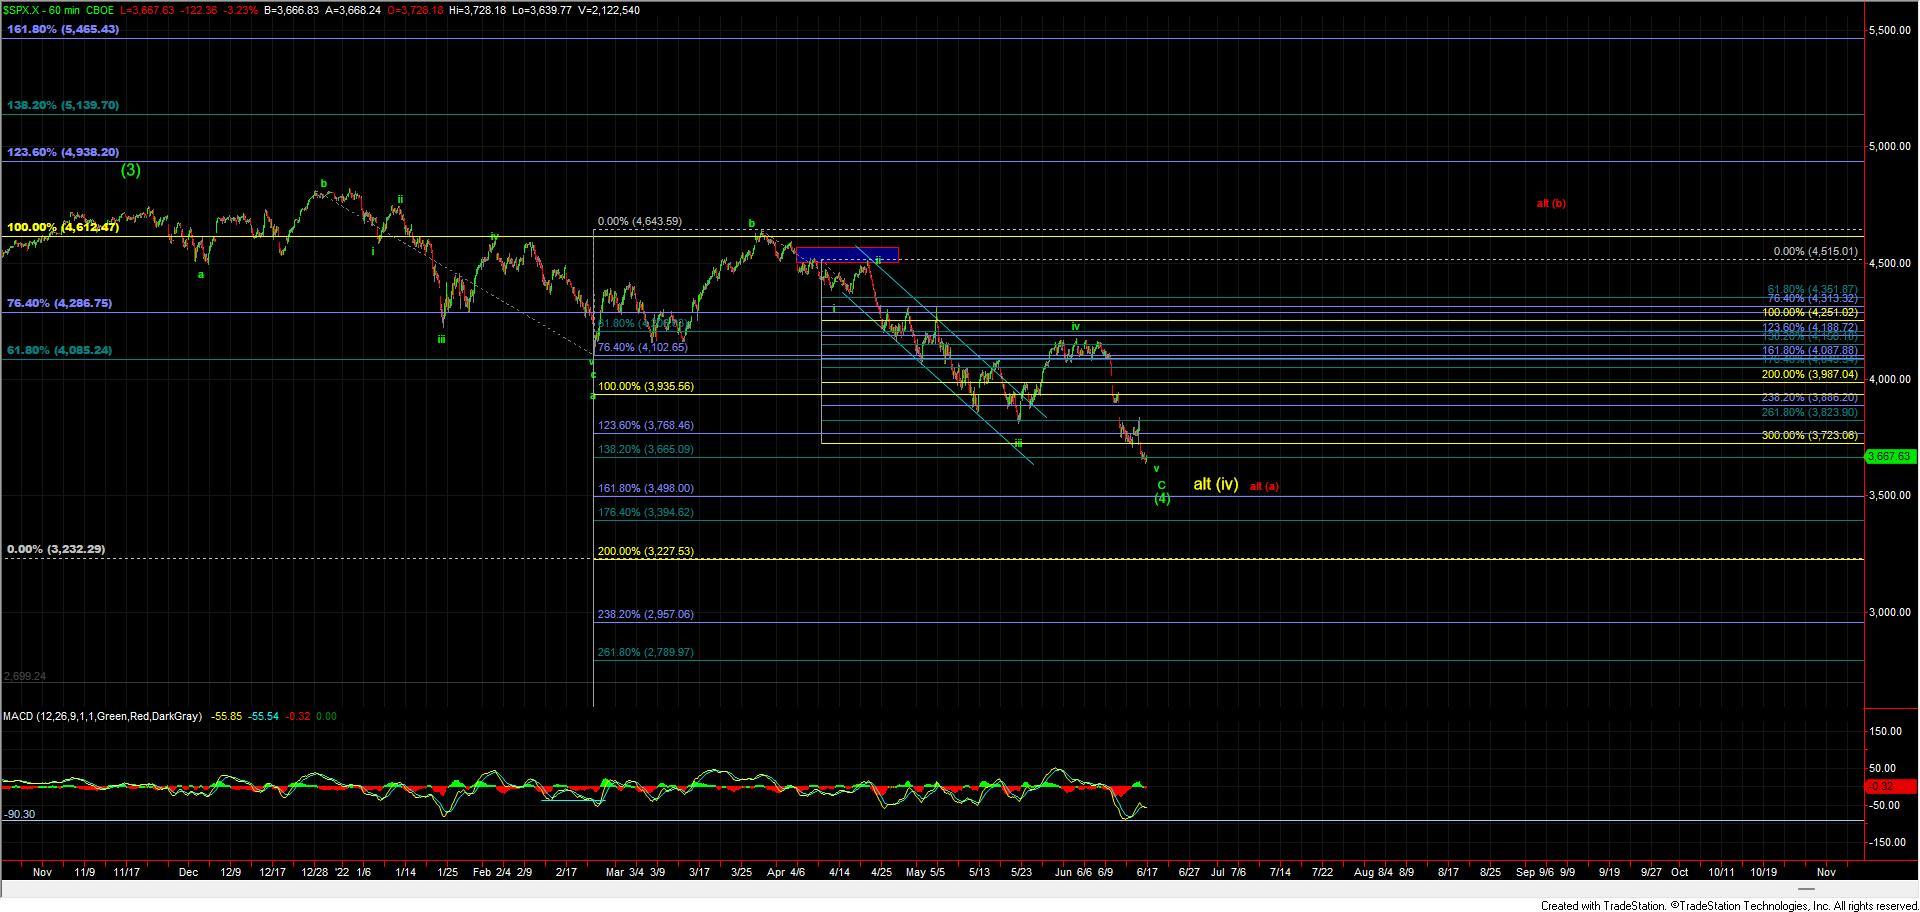
There is very little change to the larger degree SPX chart and I am still counting this move down off of the April high as a C wave with this move into current levels being the wave v of that wave C of (4). Today we hit the 138.2 ext of that wave a which came in at the 36665 level on the SPX. We did poke under the fib slightly but we have not made what I would consider a sustained break of it just yet. Furthermore, both the NQ and RTY are trading at some smaller degree key fibs and the UVXY has also made a turn near its key fib. So with that, the market is providing us with an excellent opportunity to find at least a local bottom in this zone with the potential for it to turn into a more significant bottom in the larger degree wave (4). I do however want to caution that this would still only be the first step in that bottoming process in that although the pattern is potentially complete we still need to see additional confirmation that a low has indeed been struck. That confirmation would come first by seeing a clear five wave move to the upside. This would then need to be followed up with a break over resistance. Both of these things also would be happening on varying degrees. So first we would want to see a five wave move of a smaller degree and a break of resistance also on a smaller degree. This process is then repeated as we continue to push higher at which point we move our support and resistance levels higher and higher as we move through the wave degrees.
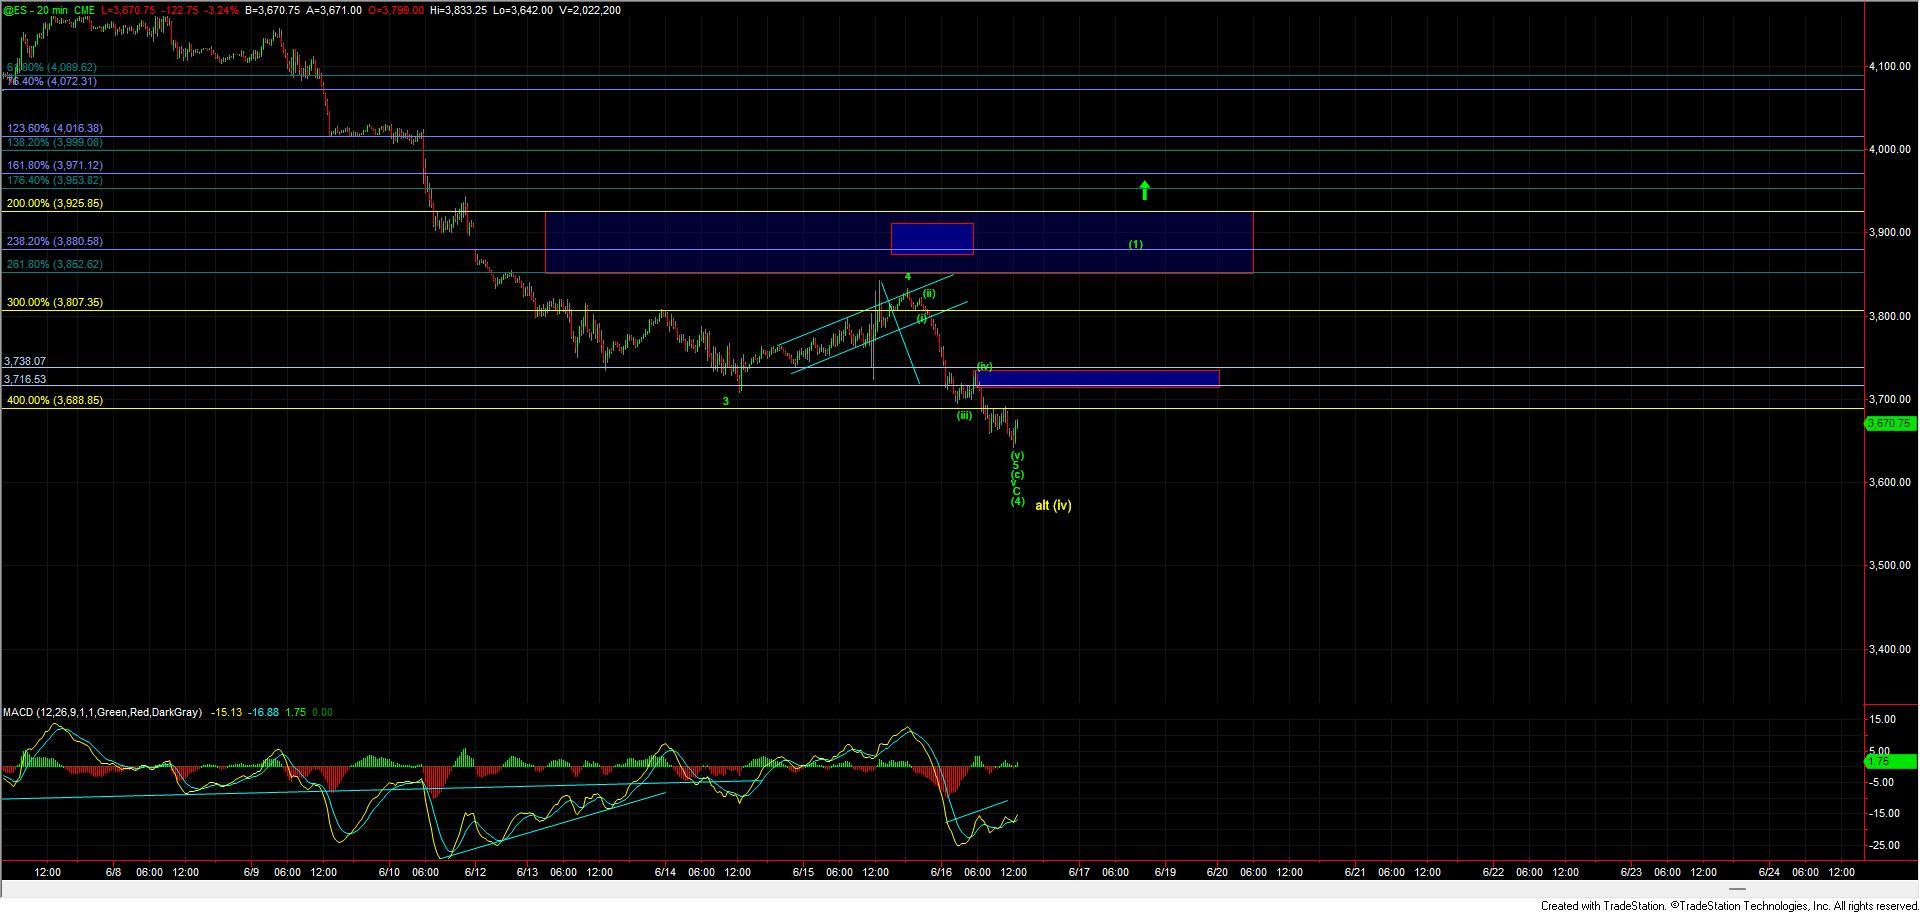
So with that and drilling down to the smallest degree I would want to ee the ES break over the 3738 level and give us a five wavemove over that zone. This should then be followed up with a five wave move of one larger degree that pushes through the 3852-3925 zone. Moving through that zone on five waves I would then be looking for a wave (2) pullback that would provide us with the next higher probability opportunity to the long side. If and when that does occur we can then layout the path with the resistance and support levels to watch for the market to move into over the course of the next several months. For now however and until we see this market confirm a bottom as laid out above it still is not out of the question that this will extend lower.