Step By Step Analysis
I am going to walk you through my thought process, so you can understand why I am coming to my conclusion today.
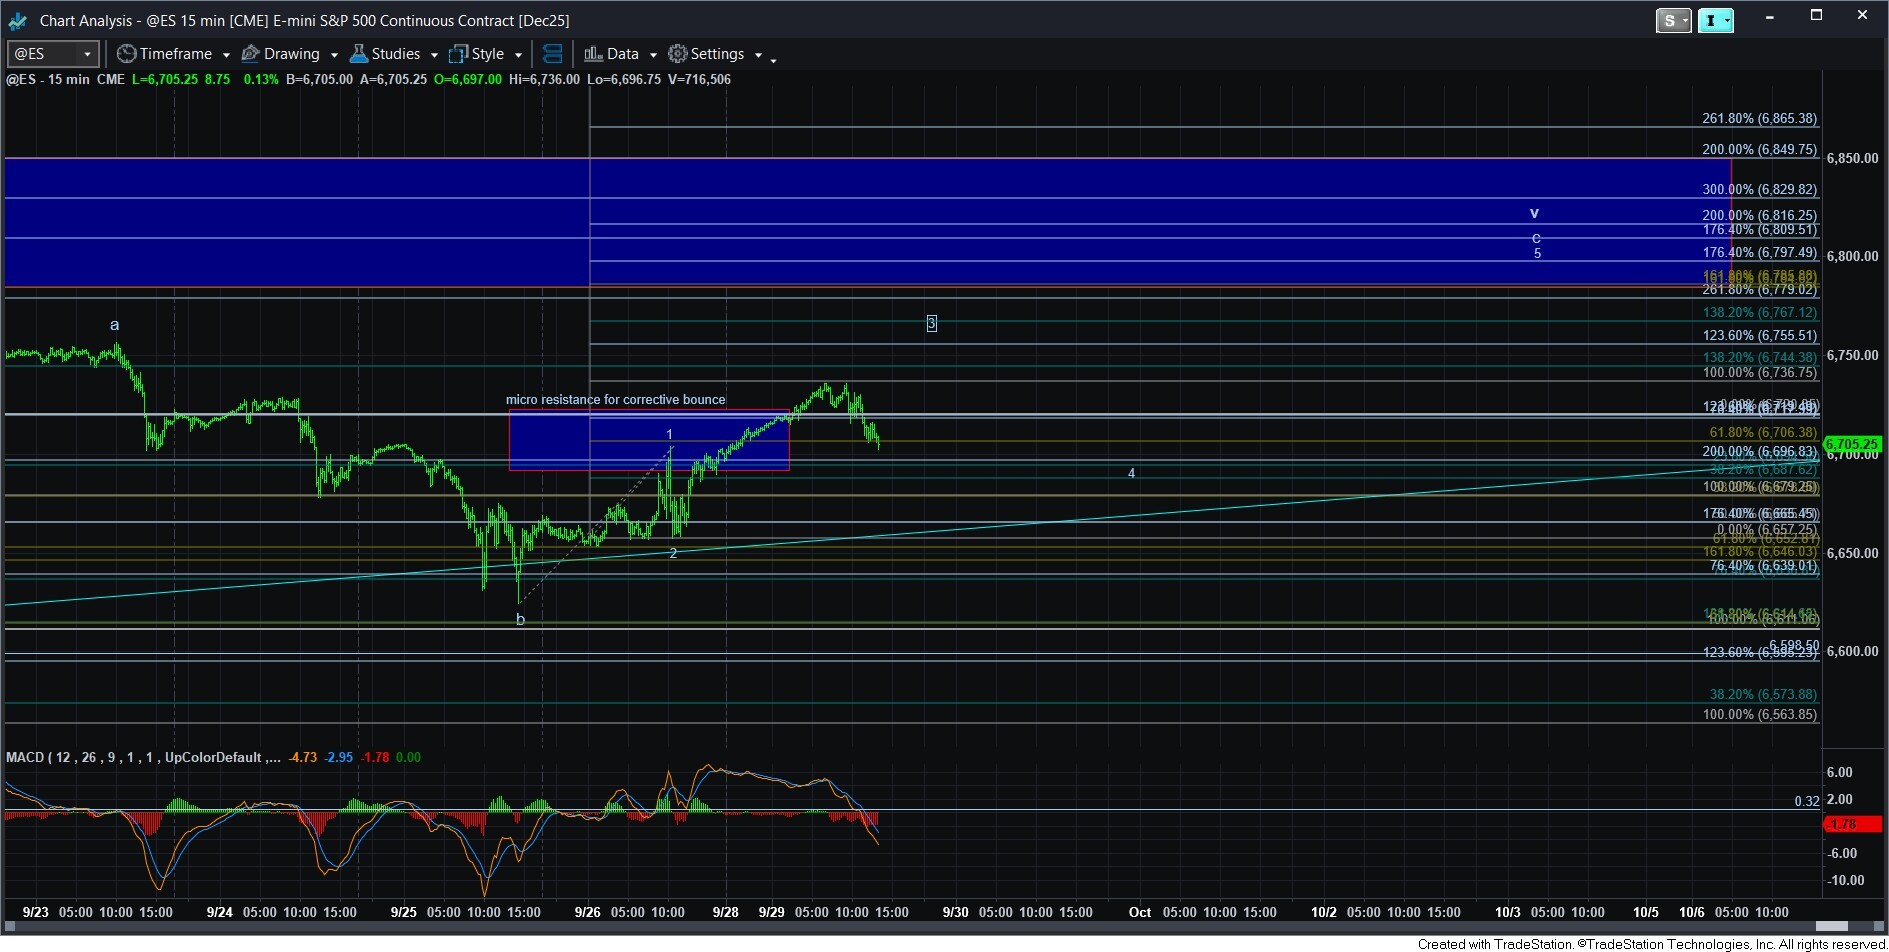
The market drifted a bit higher today, and has moved beyond the resistance noted on the ES chart. However, it stopped right at the 1.00 extension off last week’s low, which ordinarily is indicative of an (a)(b)(c) rally. This supports a b-wave primary count, with an expectation of a c-wave decline to begin.
Moreover, if the market had intentions on rallying higher in the ending diagonal for the c-wave of v, the path shown on the 15-minute ES chart, then wave 3 in an ending diagonal usually targets the 1.236-1.382 extension of waves 1-2. Again, since we seemingly topped at the 1.00 extension it also does not strongly support the ending diagonal scenario – at least for now.
So, due to where the futures topped today, I think it causes us to still view the b-wave high as the primary target, even though we did exceed the general b-wave resistance by a little.
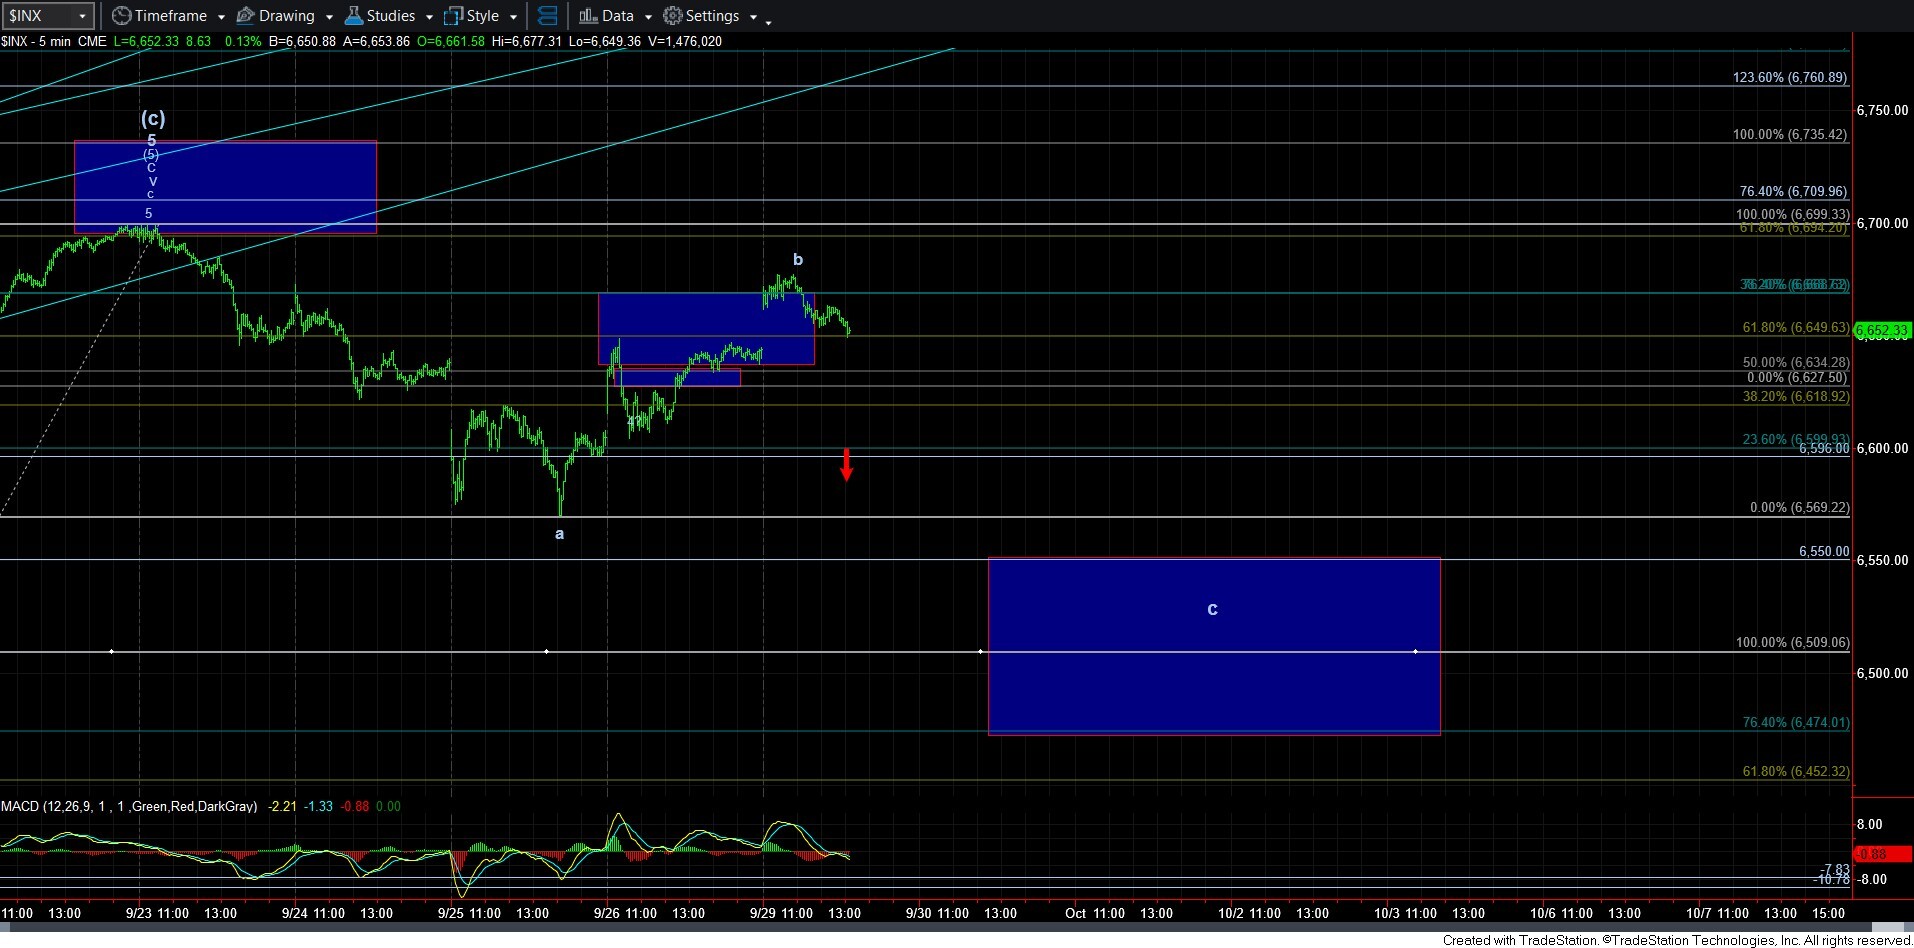
The issue is that a c-wave normally is a 5-wave structure, and wave 1 of that 5-wave structure should also be a 5-wave structure. The decline in the ES looks more like a 3-wave structure, or a developing leading diagonal to the downside. So, clearly, this is an issue with the b-wave high count.
So, my conclusion is that I am going to view this as a b-wave high today, until the market is able to break out over the high structure in the futures. Should that occur, then we have to abandon the b-wave count, and view this as a continuation move in the c-wave of wave v, as outlined on the 15-minute ES chart.