Starbucks Closure Causes Caffeine Withdrawl For Stock Market Bulls
While many seem to believe that this pullback, for which we have been eagerly awaiting, was due to some issues over in Italy, the truth is that it is clearly due to the lack of available coffee/caffeine due to the Starbucks closure today. I mean, you have to be fooling yourself if you think it was because of any other reason.
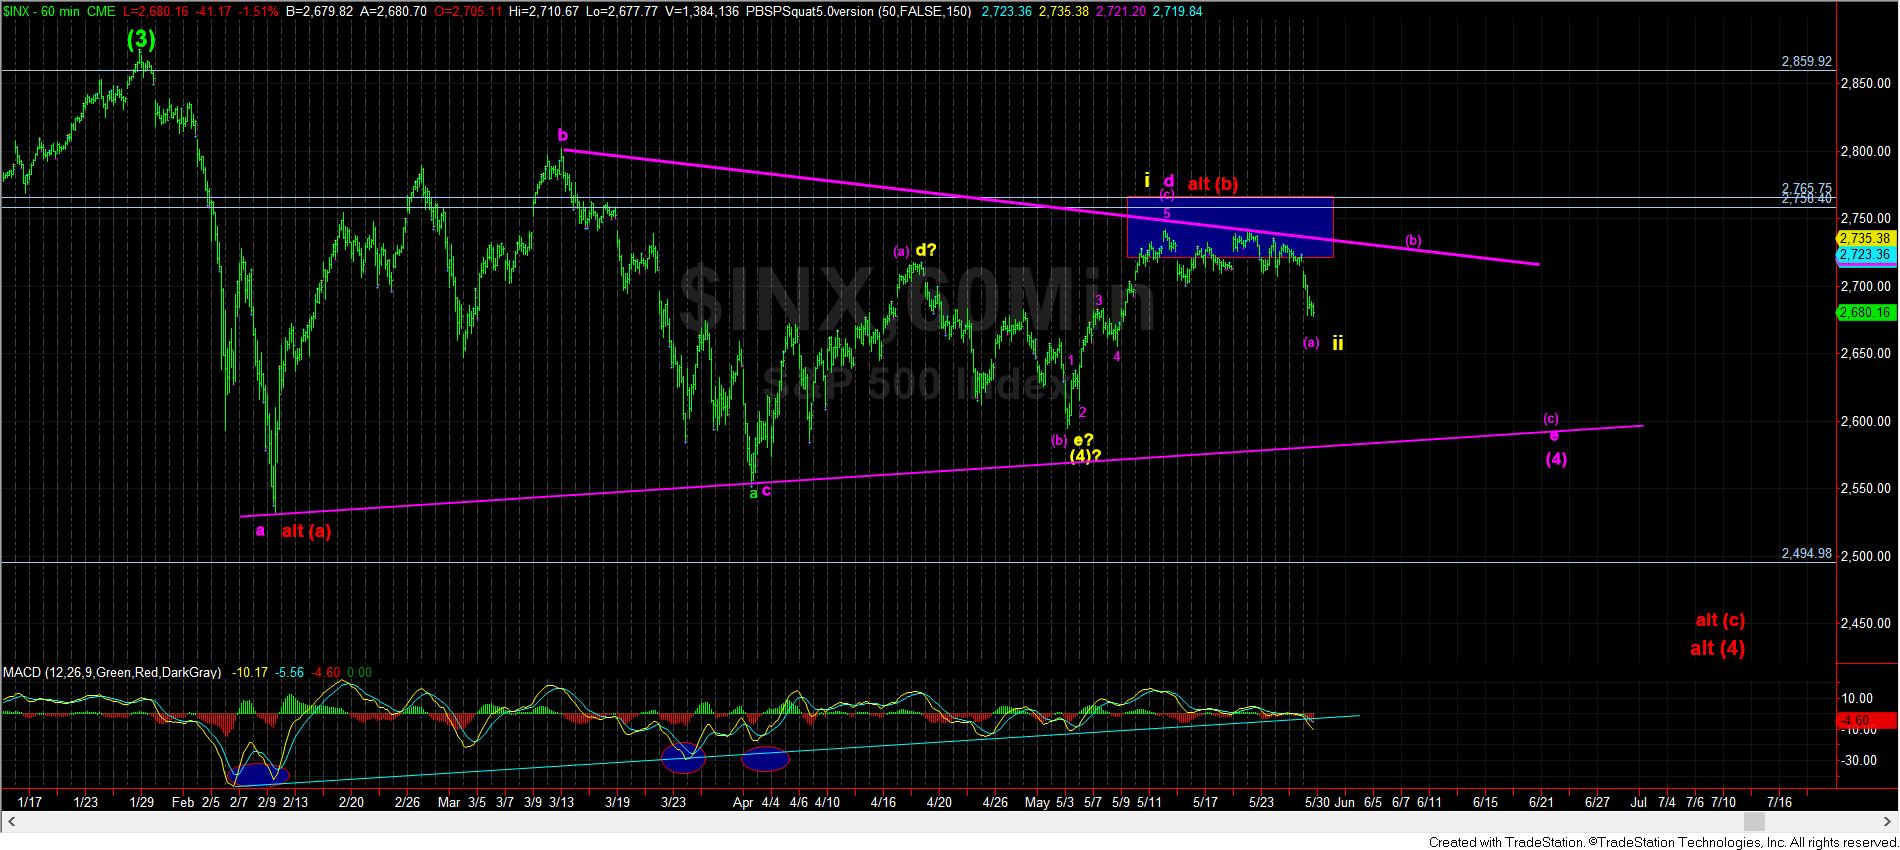
Now, in all seriousness, with the break down below 2700SPX, the market is making it clear that we are now within the throes of the pullback we have been expecting. While the SPX came up about 17 points short of the ideal target at 2758SPX, it reminds you that markets are not linear, especially during corrective structures.
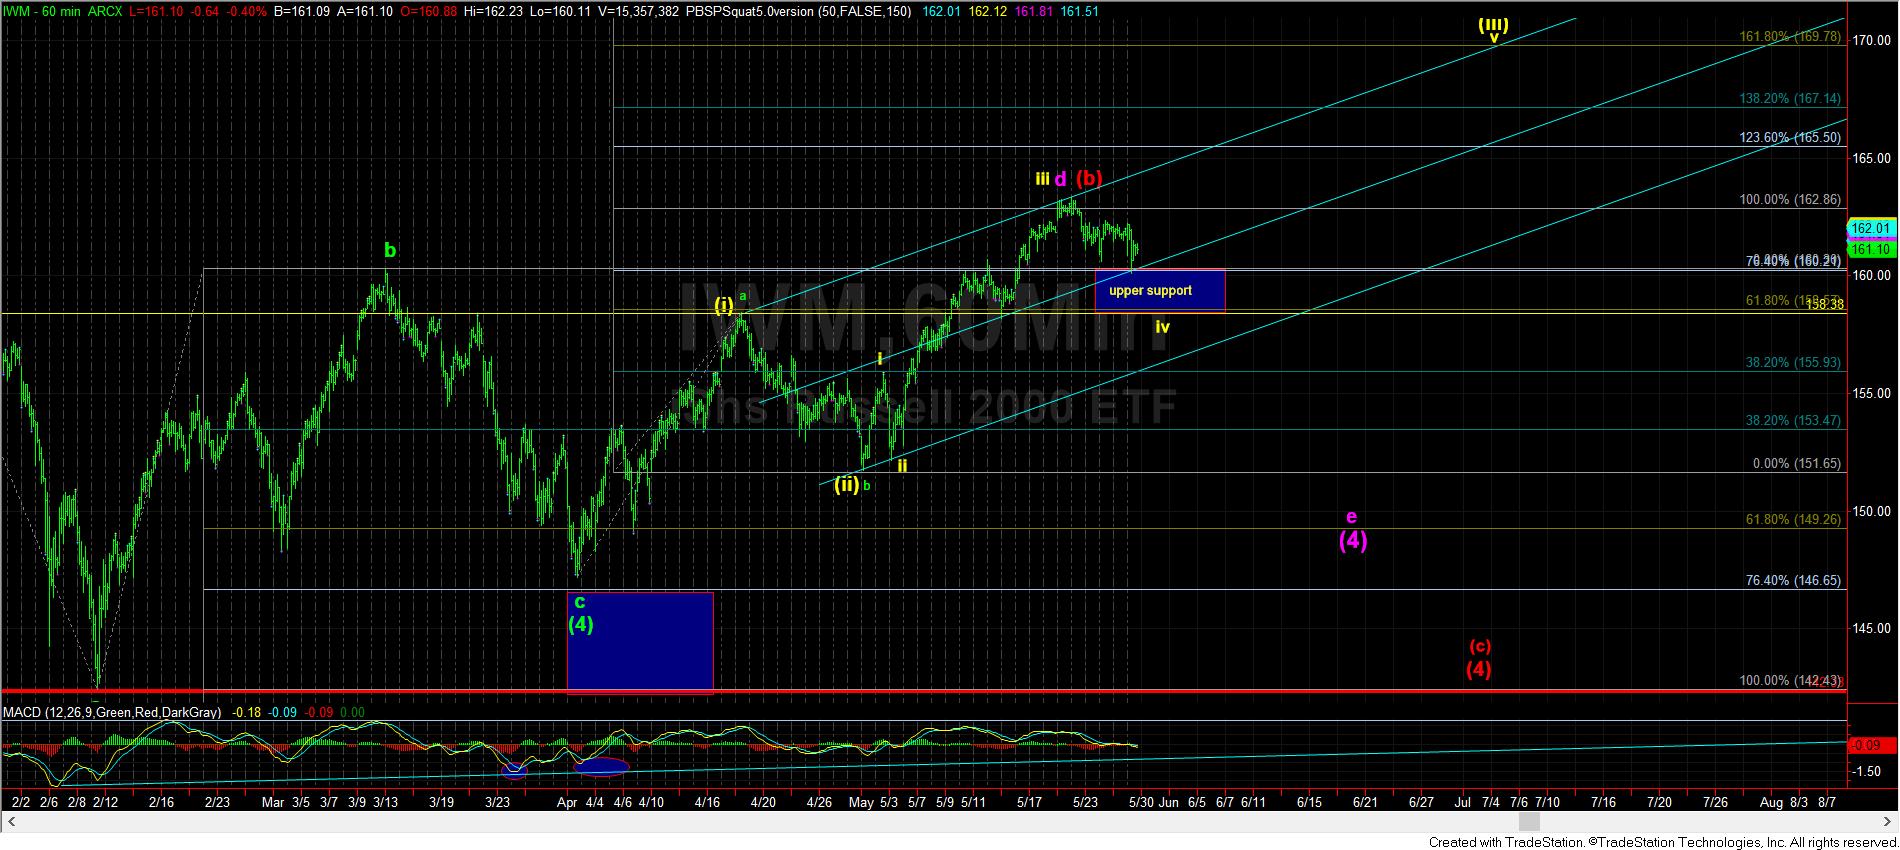
While I would still want to see more of a pullback over the coming week or two in the SPX to fill out a more appropriate 4th wave structure, I have to note that the IWM may suggest we may not see as large of a pullback as I had ideally wanted to see.
As you can see from my attached IWM chart, I have now identified an upper support region between 158-160, which may be all the pullback we see over the next week or two. In fact, in order to be able to see the larger pullback that I had initially wanted to see, we would need to see a solid break down below 158. Otherwise, should we hold support, and break out over the high we made last week, it will point us up towards the 170 region in the most immediately bullish pattern I am now tracking, as presented in yellow.
While this yellow count may actually be the same as presented in the SPX, with this actually being a wave (ii) pullback rather than wave iv of (iii) (with the low on May 1st being the bottom of a wave (4) triangle), that will be my alternative count should we hold this upper support, and break out over last week’s high. The real difference between the two potentials is that the current yellow count is pointing to 174, whereas the alternative more bullish count points to the 180 region. But, we will have plenty of time to make that determination should we see a break out sooner rather than later.
In the SPX, my preference remains that this is an e-wave of the 4th wave triangle. That would mean we should be completing just the (a) wave of the e-wave of the triangle this week, followed by a corrective (b) wave rally which must remain below 2742SPX.
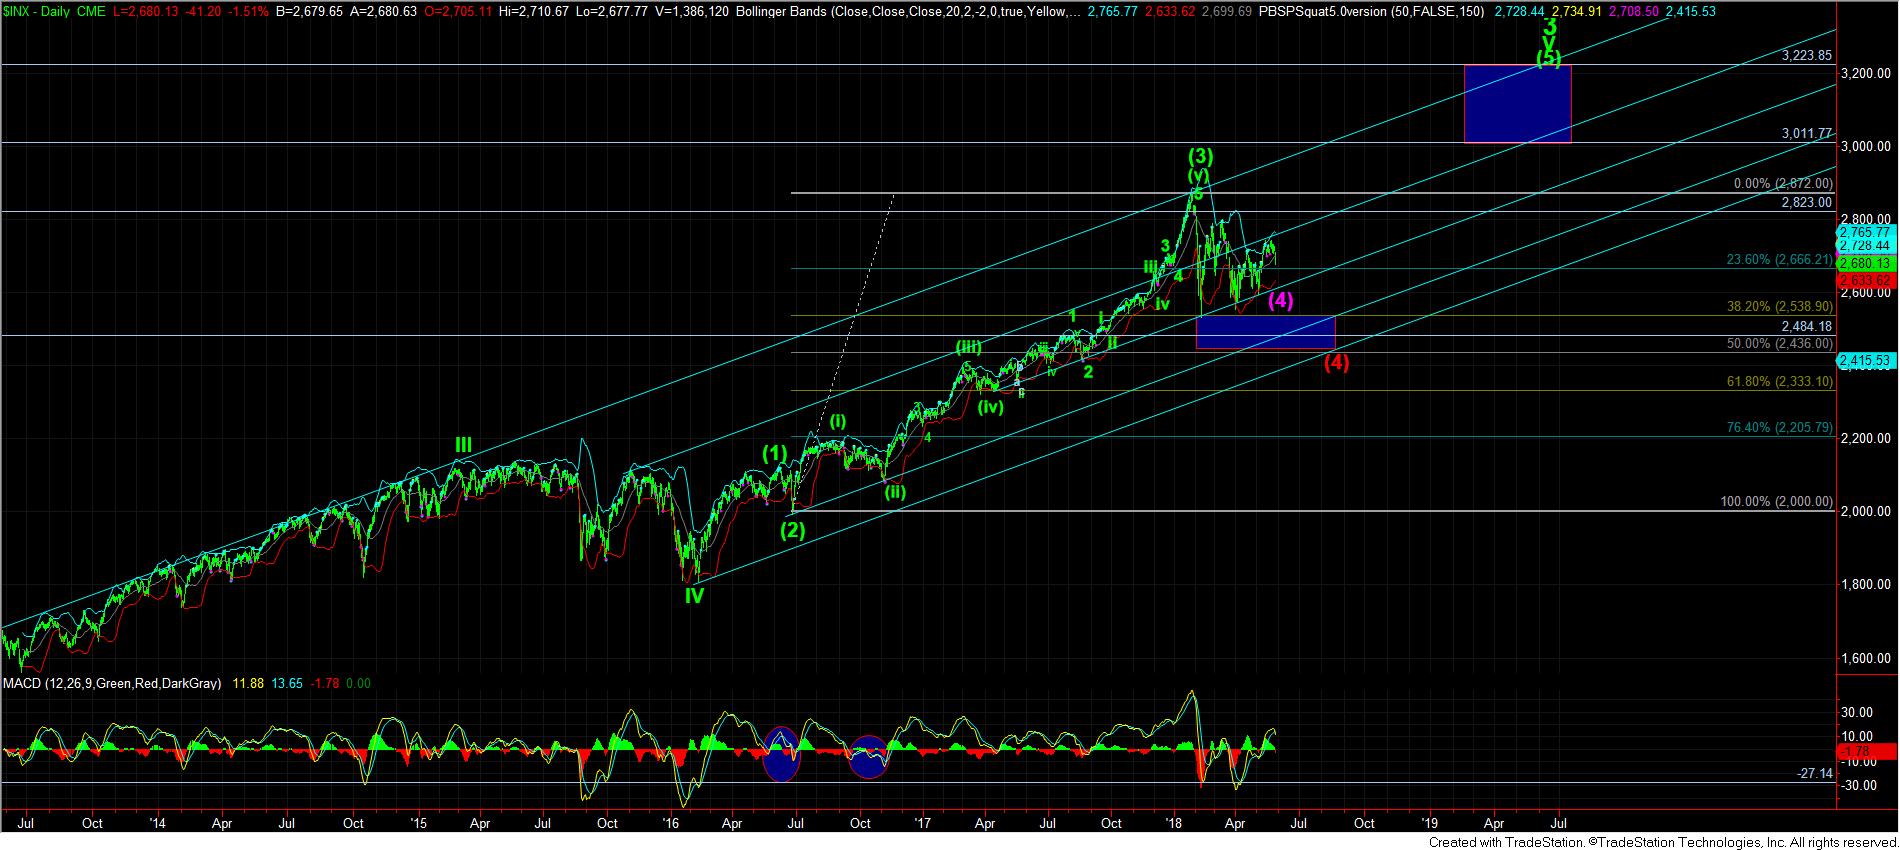
However, just like with the IWM, if we see a strong move through 2742SPX, I would have to adopt the yellow count, and view us as already having begun our rally to 3000. The only issue is that if this is the operative count, we may not see the higher 3225SPX region, as this smaller i-ii is really only pointing up just over the 3000 region, which is the lower level of our target region. Moreover, it would also suggest we can still top towards the end of 2018, rather than push all the way out into 2019.
For those that are very bearish, I will say that I cannot completely discount the red count on the SPX 60minute chart, as long as we remain below 2742SPX. If the IWM does break down below its upper support region, then a larger downside structure can take hold in the SPX. You see, we are still struggling as to where wave (4) will end since we have not seen the standard 5-wave c-wave decline which often signifies the conclusion of a correction. Rather, we have been dealing with multiple overlapping corrective moves, which leaves several potentials on the table as to how this wave (4) will end, if it has not already ended. So, should we see further weakness in the IWM below upper support, I will keep an open mind as to the potential for the SPX to head back down into the 2400’s to complete a larger wave (4), as presented in red.
But, I want to stress again that should we see a break out over the highs struck last week in IWM along with the SPX breaking out over 2742SPX, it would strongly suggest that we are in wave 5 pointing much higher over the coming months. So, please keep in mind that we are still likely setting up a move to 3000+, and we are just trying to feel out from where that will begin.