Slowly Leaking Lower - Market Analysis for Sep 29th, 2026
 By
Avi Gilburt
By
Avi Gilburt
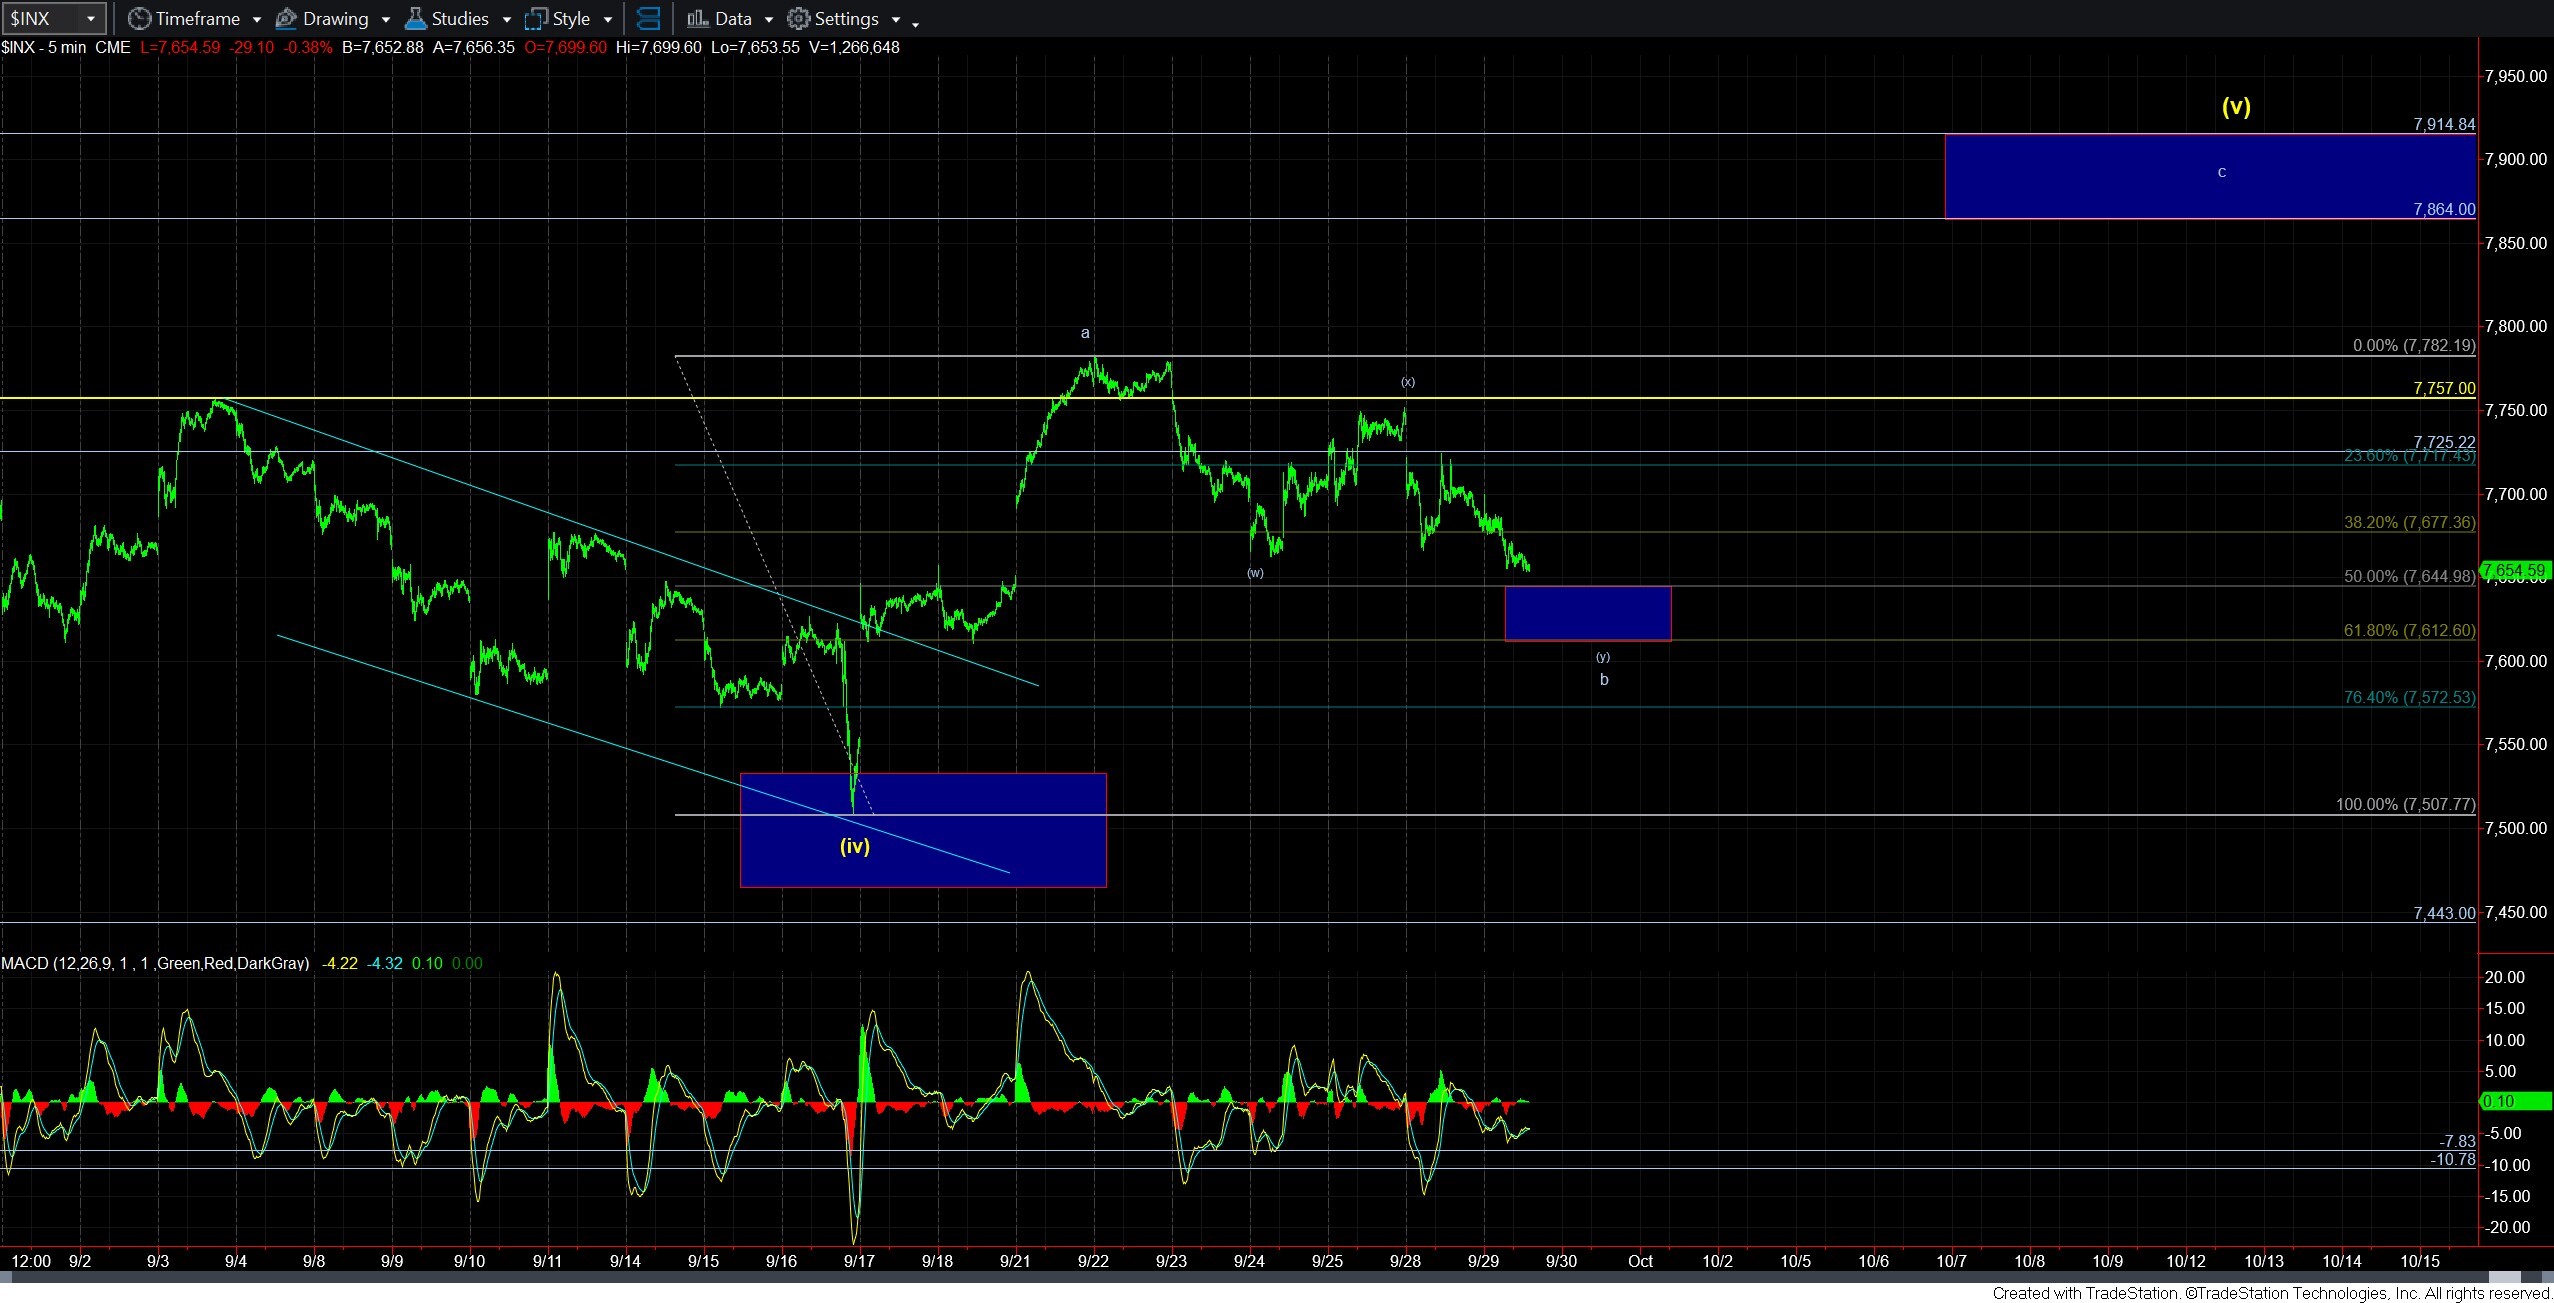
As the market is meandering down today, the pattern continues along its messy route. So much so, that I am not even posting an ES chart as the structure is too overlapping to come up with anything that is reasonable. So, for today, I am simply posting the SPX charts, as they seem cleaner.
As I mentioned in yesterday’s update, I am forced to view the current structure as a (w)(x)(y) complex structure within this b-wave. And, within this structure, there are a number of calculations of wave relationship ratios which suggest that the .500-.618 retracement of the a-wave is a reasonable expectation for this b-wave pullback to hold as support.
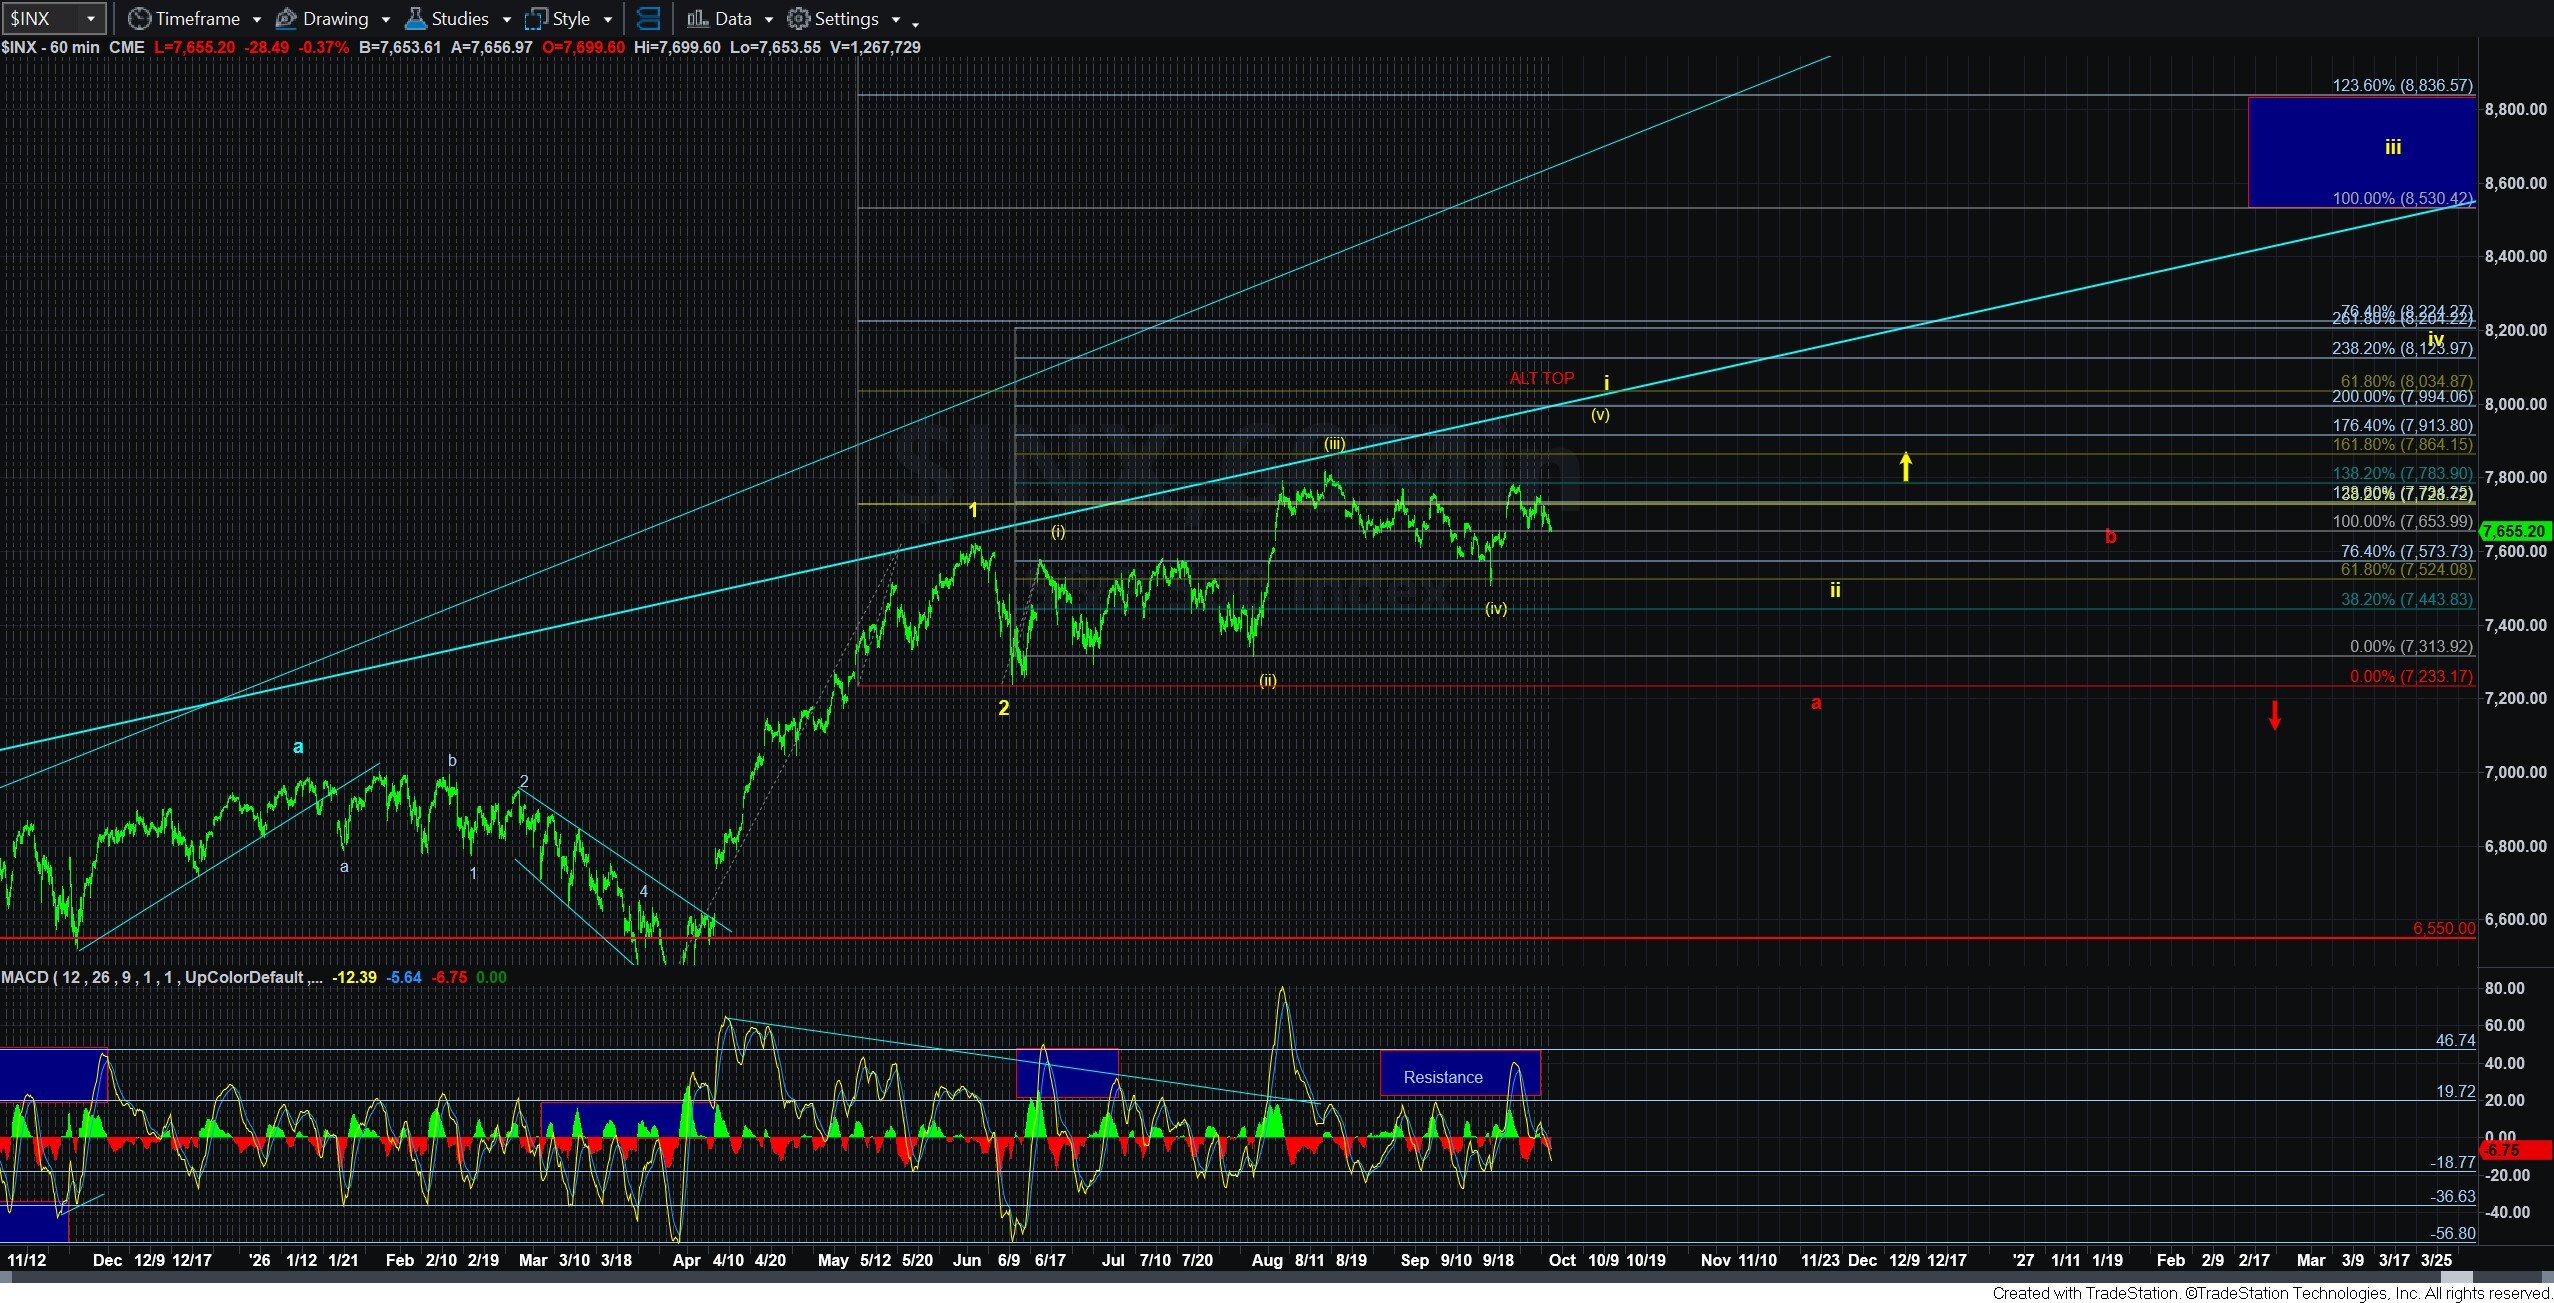
So, as we approach that support box on the 5-minute SPX chart, we should be alert to the potential for a 5-wave rally structure for wave 1 of the c-wave higher, especially in light of the positive divergences seen on this time frame. Moreover, note that the MACD on the 60-minute chart is also moving into a support region from which other rallies have also begun.
Of course, should the market break down below this support box, then we will have to re-assess. But, for now, this seems to be the most reasonable approach to this overlapping and quite uncertain structure.