Slow Moving Downside - Market Analysis for Aug 31st, 2016
Our primary count had us looking for the heart of a 3rd wave to take hold to the downside. And, they usually start with large gaps down. But, we have not really seen any such action. Moreover, the technicals have not really been supportive that this is a 3rd wave down, just yet. While if tomorrow provides us with a 20+ point decline, I am sure that would be rectified. But, the action has made me question the markets intention in this region.
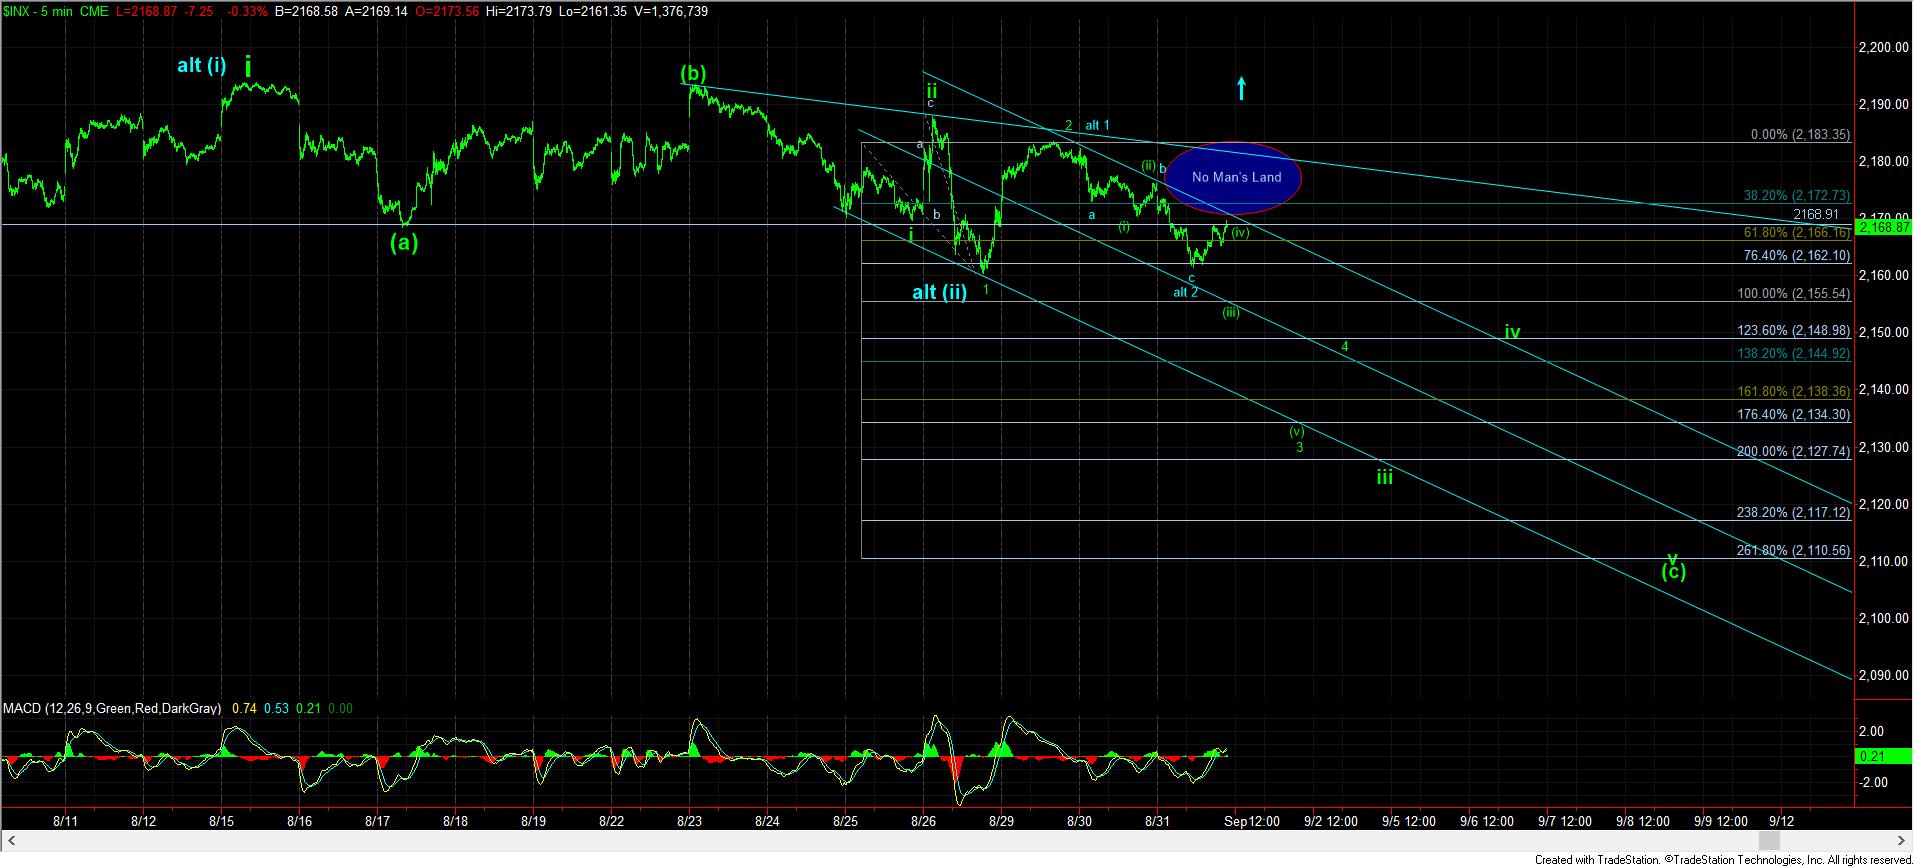
As you can see from the attached 5 minute chart, I really wanted to see us down in the 2156SPX region - the 1.00 extension down in the wave iii down, to provide strong confirmation that the market is heading down in an impulsive structure for this (c) wave down.
But, once we dropped towards the low we struck on Friday, the market was unable to break below that low just yet. In fact, holding that low still keeps that alternative blue count on the chart, and it has been quite frustrating to see it hold on for so long.
For now, if the market is able to move through the 2170SPX region, and into the "No Man's Land" noted on the 5 minute chart, I would view two patterns as having equal probability. The first would be that the market is developing as an ending diagonal down for this (c) wave, which would make it exceptionally difficult to trade and trade. The other potential is that the blue count is actually taking hold, and taking us to the 2350 region sooner than we had initially expected.
So, for now, as long as we remain below the 2170 region, then I can still look for a gap down tomorrow. But, should we see no gap down, or if we move into the No Man's Land, then it will leave us wanting for a solid pattern to confidently trade. As long as we remain below 2183SPX, the ED down for the (c) wave is strongly in the running. But, over 2183SPX, the probabilities significantly shift towards the blue count, which would likely be pointing us initially to the 2220-2230SPX region next.