Sloppy Market Action Leaves Door Open Further Whipsaw
 By
By
Today we saw the market push sharply higher into the 2 pm FMOC announcement only to see the majority of those gains erased post-announcement. This was not entirely unexpected price action however as we were looking for the market to find a local bottom near the lows today and a local top close to where we did indeed find a top as the market continues to whipsaw in what is very sloppy short-term price action. The question at hand now is whether the high today will lead to another push under the 3793 level or whether this can find a more immediate bottom and push to new highs to attempt to finish a potential leading diagonal up off of the lows. While the price action is far from reliable we can lay out some parameters to help give us some guidance as we move into the end of the week.
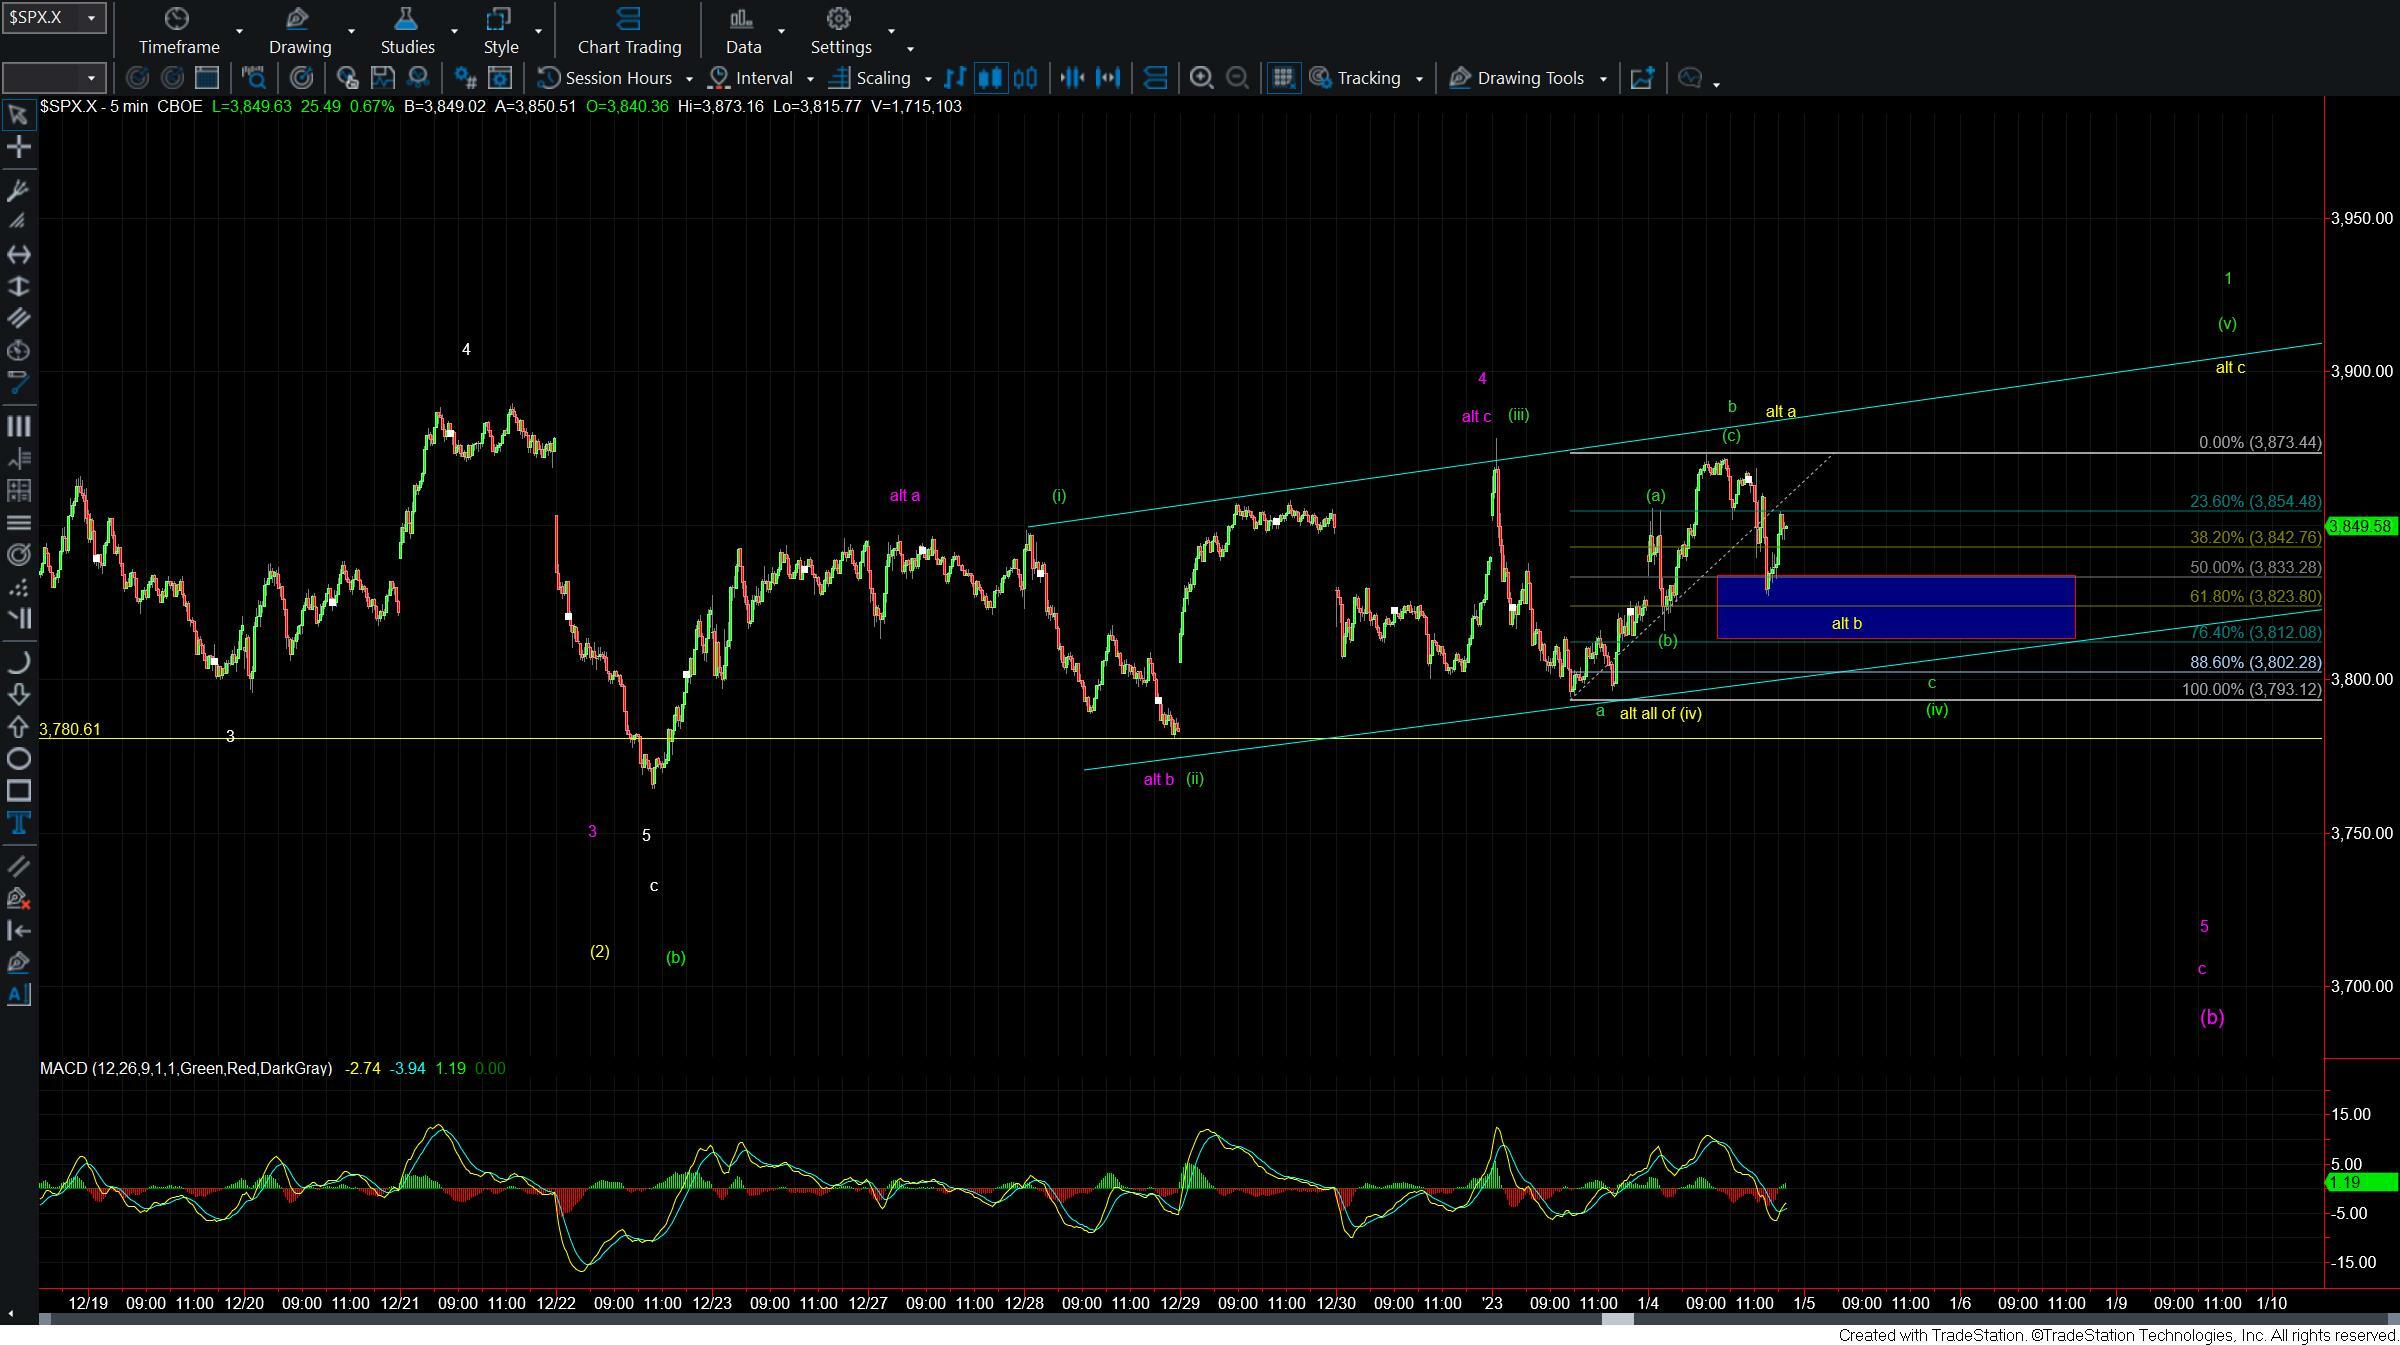
Looking at the five min SPX chart I have laid out three different paths. The green and the yellow are part of the already bottom in case in which we are looking to fill out a leading diagonal up off of the 12/22 low. The difference between these two counts in that the yellow count would suggest that we have already bottomed in all of the wave (iv) per that leading diagonal and are in the wave (v) up, whereas the green count would still need another lower low under the 3793 level to finish off the wave c of (iv).
If we break out over the HOD at the 3873 level then the yellow count would take the lead and would suggest we are in the final wave c of (v) of 1 up. Support for that yellow count comes in at the 3823-3812 zone below. Over that zone and I still would allow for the yellow wave b to find a bottom. Should the SPX be unable to hold over the 3812 level and then break under the 3802 level we likely will see this push towards the 3793 low to finish off the wave c of (iv). From there we would need to hold over the 3780 level to keep the green count in play and still look towards a new higher high to finish off the wave (v) of 1.
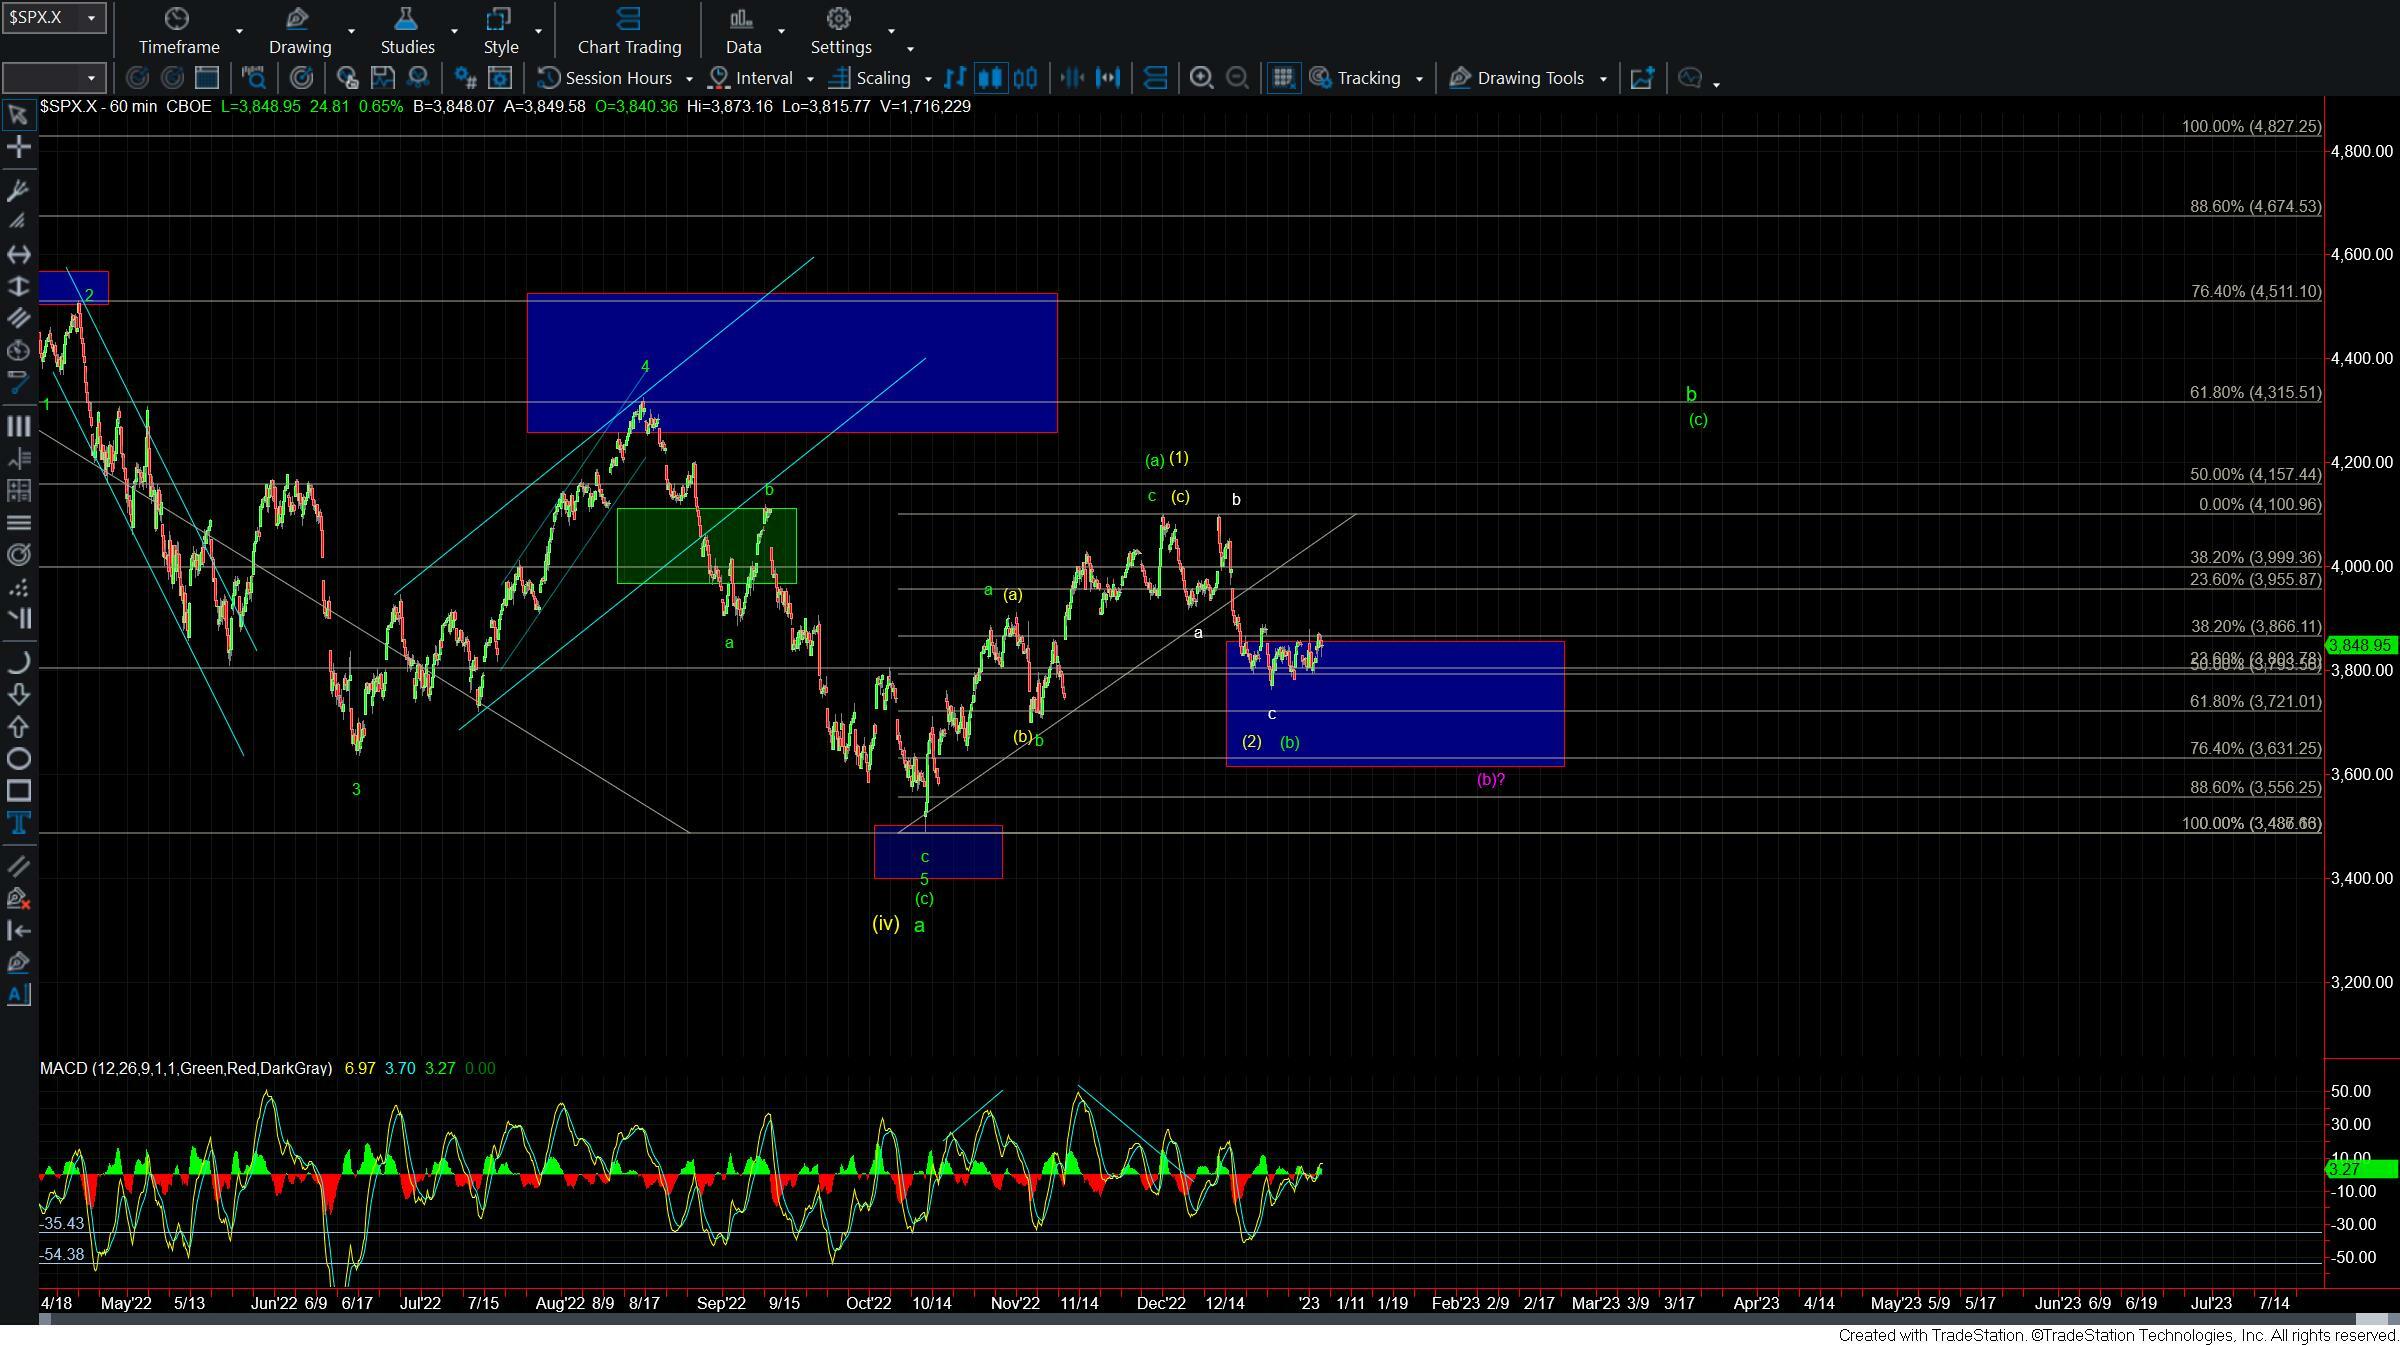
If we break 3780 then it makes it likely that we will see a break back below the 12/22 low and a move down to the 3720 level and potentially as low as the 3631 level as they represent the 61.8 and 76.4 retrace levels of the entire move up off of the October lows and into the December highs. These levels can be seen on the 60min SPX chart attached.
So while the market does continue to chop around in the same region for the past few days we do at least have some decent parameters to work with here as I have laid out above. In the meantime the more conservative approach to trading his market is to simply wait to see if we can develop a full five up off of the lows and follow that up with a corrective retrace. Unless and until that occurs this market will likely remain somewhat treacherous for all but the most nimble of traders.