Sloppy Action Off Of The Lows Leaves The Door Open To A Number Of Paths
 By
By
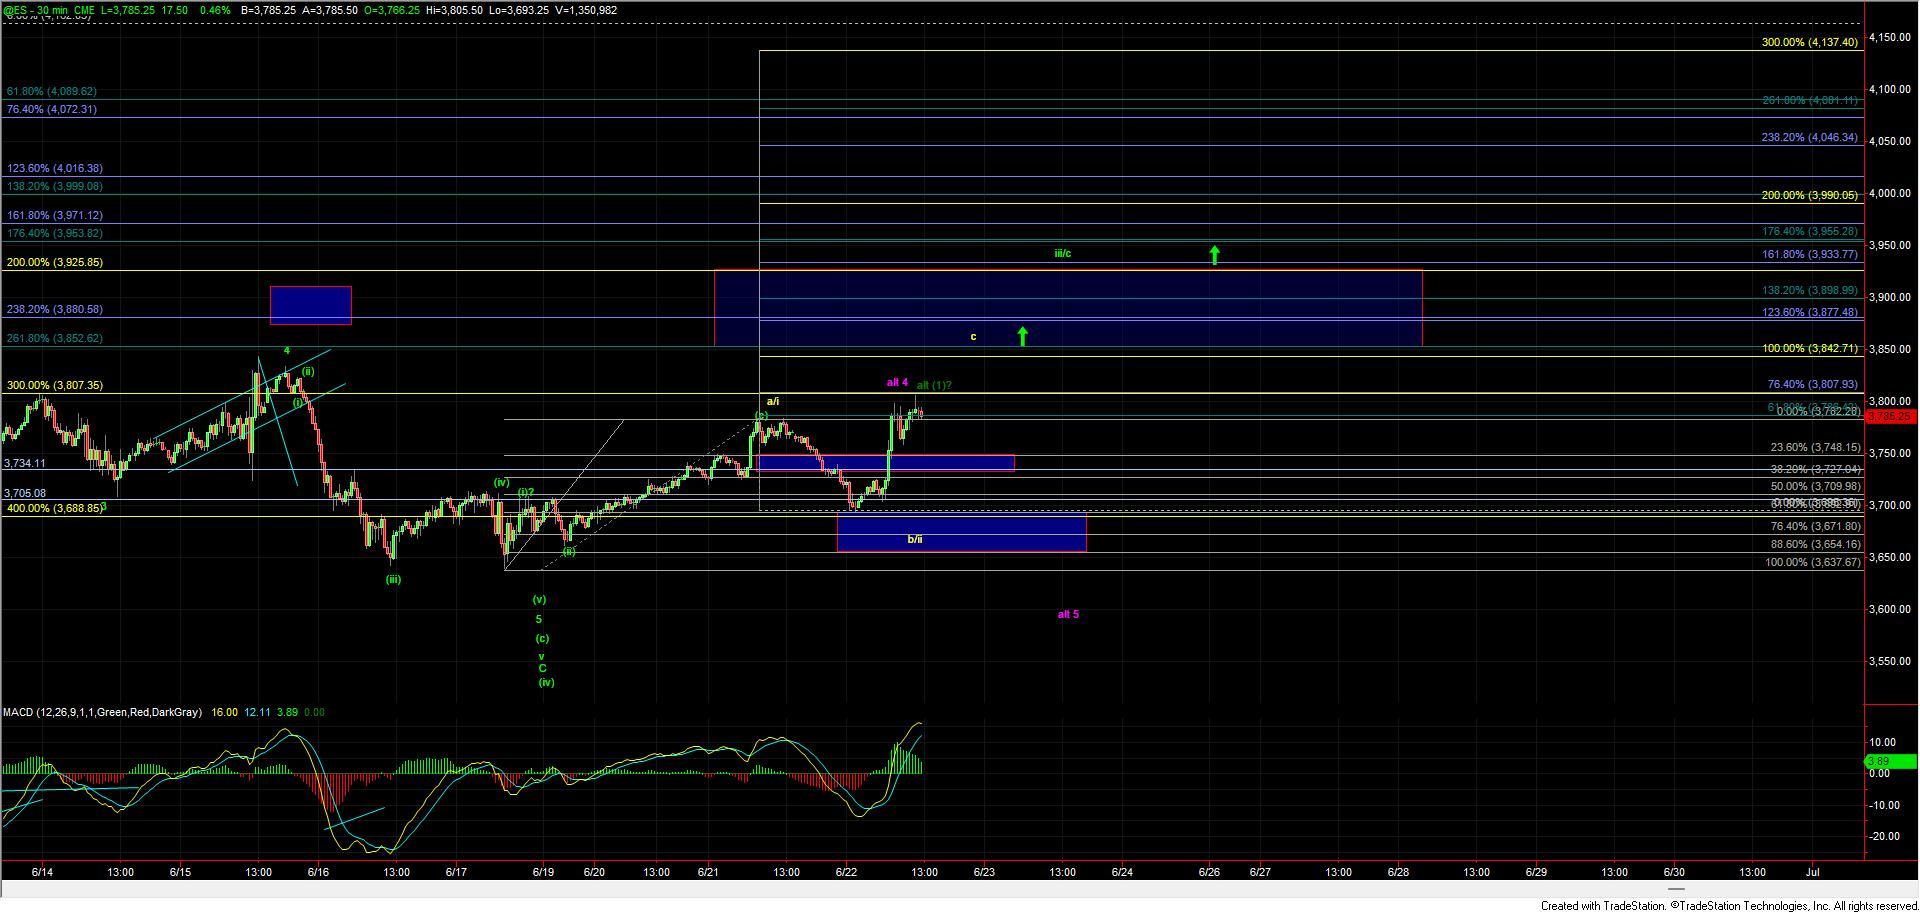
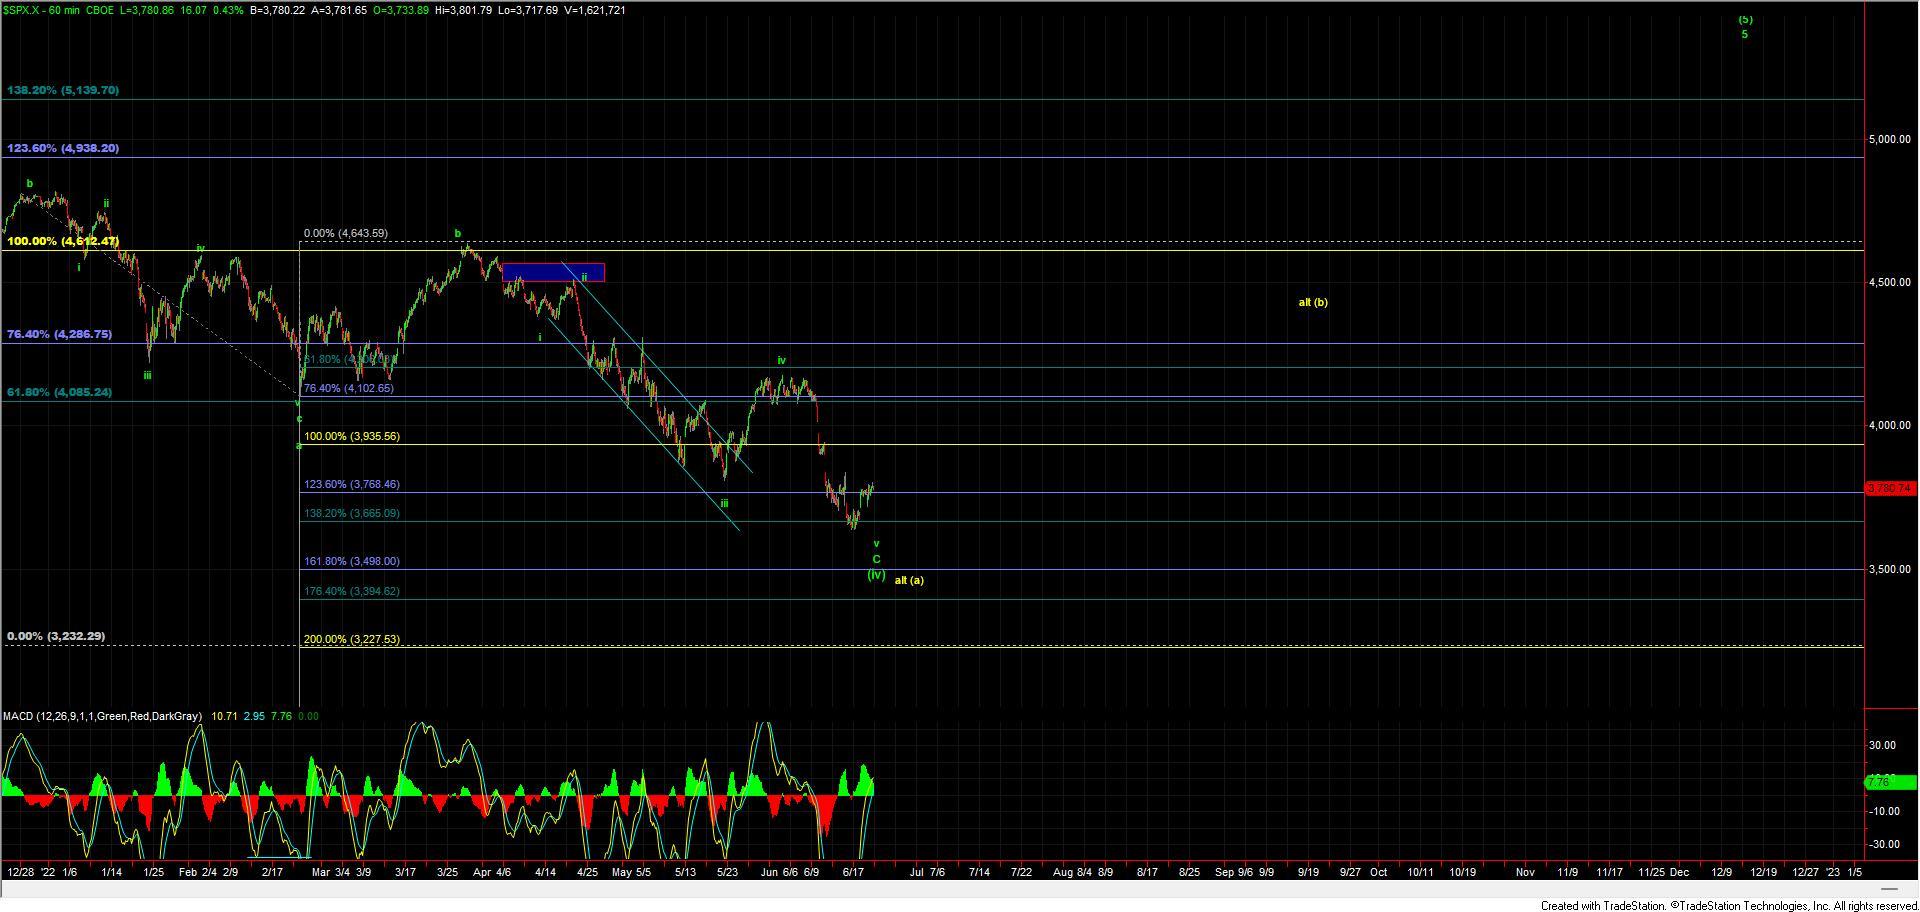
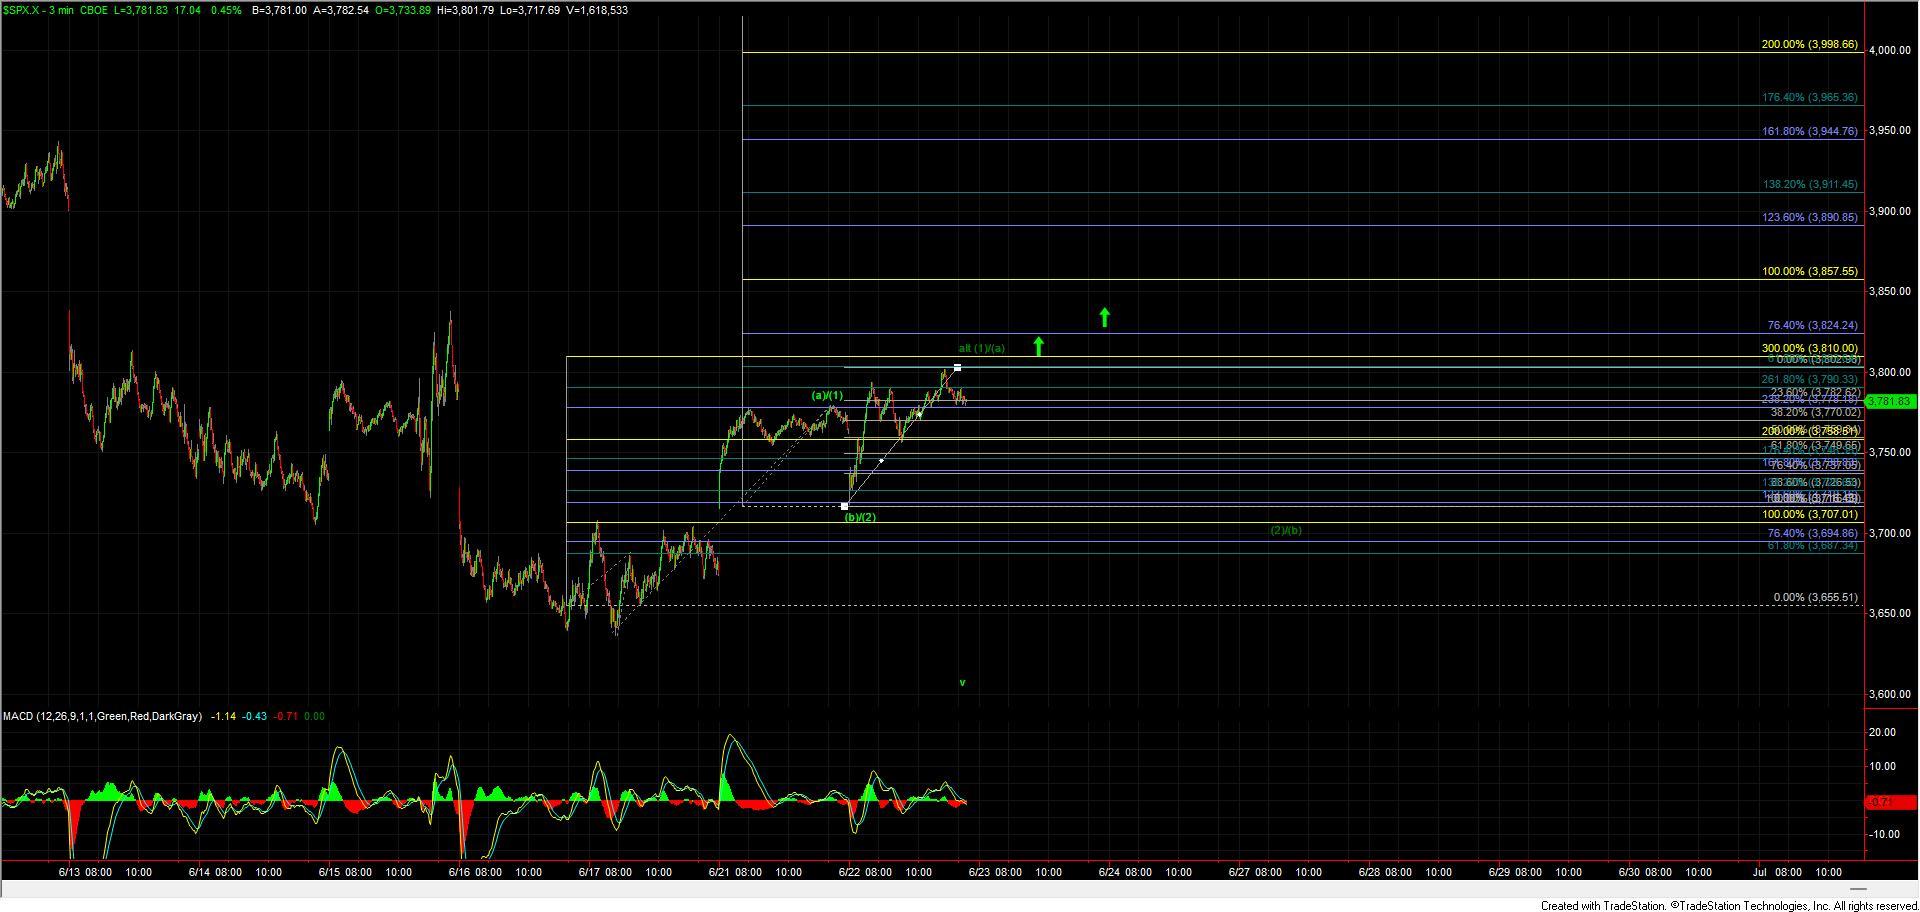
Overnight the markets broke down below the support zone for the micro wave (iv) that we had been watching off of the lows yesterday. This break gave us what counts best as only three waves up on the ES and the SPX at the open. Later during the morning session, we saw the market push higher again breaking back up over yesterday's high thus opening the door to a number of possibilities and also a bit of a discrepancy between the ES and SPX micro counts. On the SPX today's high could count as the fifth wave of a non-overlapping five-wave impulsive move up off of the lows whereas it is much more difficult to consider the same for the ES. Furthermore, I have a very difficult time seeing a similar pattern in the Russell 2000 or inversely in the Volatility markets. In fact, those markets are suggestive that today's push higher may already be the wave c or iii of the next micro move up off of the lows. The issue is however that the initial move up that topped yesterday is far from an ideal start. For that reason, I am going to focus in on the larger degree of price resistance levels overhead to help give the near term guidance here and allow the market to fill out a bit more to help give us further confirmation as to whether we have indeed struck that larger degree bottom in the wave (4) or whether we are dealing with the more complex corrective yellow pattern or whether we will see yet another lower low.
Starting with the SPX chart and as noted it is possible to count today's high as the top of a fifth wave of a wave (1)/(a). Under this case however, we would need to see this hold under the 3810 and 3824 levels on the SPX and then see a corrective retrace lower to start a possible wave (2) down. If we were to see a direct break through these levels then I would have a very difficult time considering this still one single five wave move up off of the lows and would rather count the move off of today's LOD as a wave (3)/(c). This is in fact my primary count and how I think this counts best on the ES as well as the RUT and NQ charts. Now this is not to say that we may not see a pullback before breaking directly higher however any pullback under this case should hold over the 3737 level on the SPX after which we should see a strong breakout higher. If we can indeed make a break over that 3824 level then the next key overhead resistance on the SPX comes in at the 3857 level which would put us right in the middle of the overhead resistance zone that I have been watching for some time on the ES chart. From there I still would need to see a push through 3925 ES to give us further confirmation that a larger degree bottom may indeed be in place. From there I will simply monitor the structure of the next price action to see how things are developing and if we can get a larger degree five wave move it would helpful in tracking the path as we move higher for the larger degree wave (v).
If we are unable to move higher but rather fail while holding under the 3850-3925 zone on the ES then it would still leave the door open to the purple count which could still see yet another lower low before finding an ultimate bottom. While certainly not ideal and not the path that I am leaning towards at this point in time the sloppy price action up off of the lows has left the door open to this potential so therefore I must include it as a possibility.
I will note that the price action that I am seeing in the Volatility markets is still very much supportive of the equity markets having already found a bottom or being very close to a bottom. We do however still need to get this through the next resistance levels overhead as noted to give us further confirmation that a bottom is indeed in place. So while this has certainly been a very difficult market to trade patients and waiting on the proper setup will remain key here until the market breaks out over resistance thus giving us the next level of confirmation that a bottom is indeed in place.