Sloppy Action Continues But SPX Is Still Holding The Line
After coming within a few points of pushing back over the February 2nd high and giving us final confirmation that we have indeed already put in a bottom in the wave (4) we saw the market continue to pullback today, thus forcing us to keep the blue count which still could see this push back under the 4220 low before finding an ultimate bottom in the wave (4). So far the action to the downside is however still only taking the form of three waves off of the high which at this point in time is still supportive that we are following the green count needing another push higher to finish off the wave 1. If however the move down off of the high continues to move lower and follow-through as a full five-wave move down then it would give us the initial signal that we may have indeed topped in the blue wave (b) and are heading lower in the blue wave (c). I will lay out the parameters for both paths below.
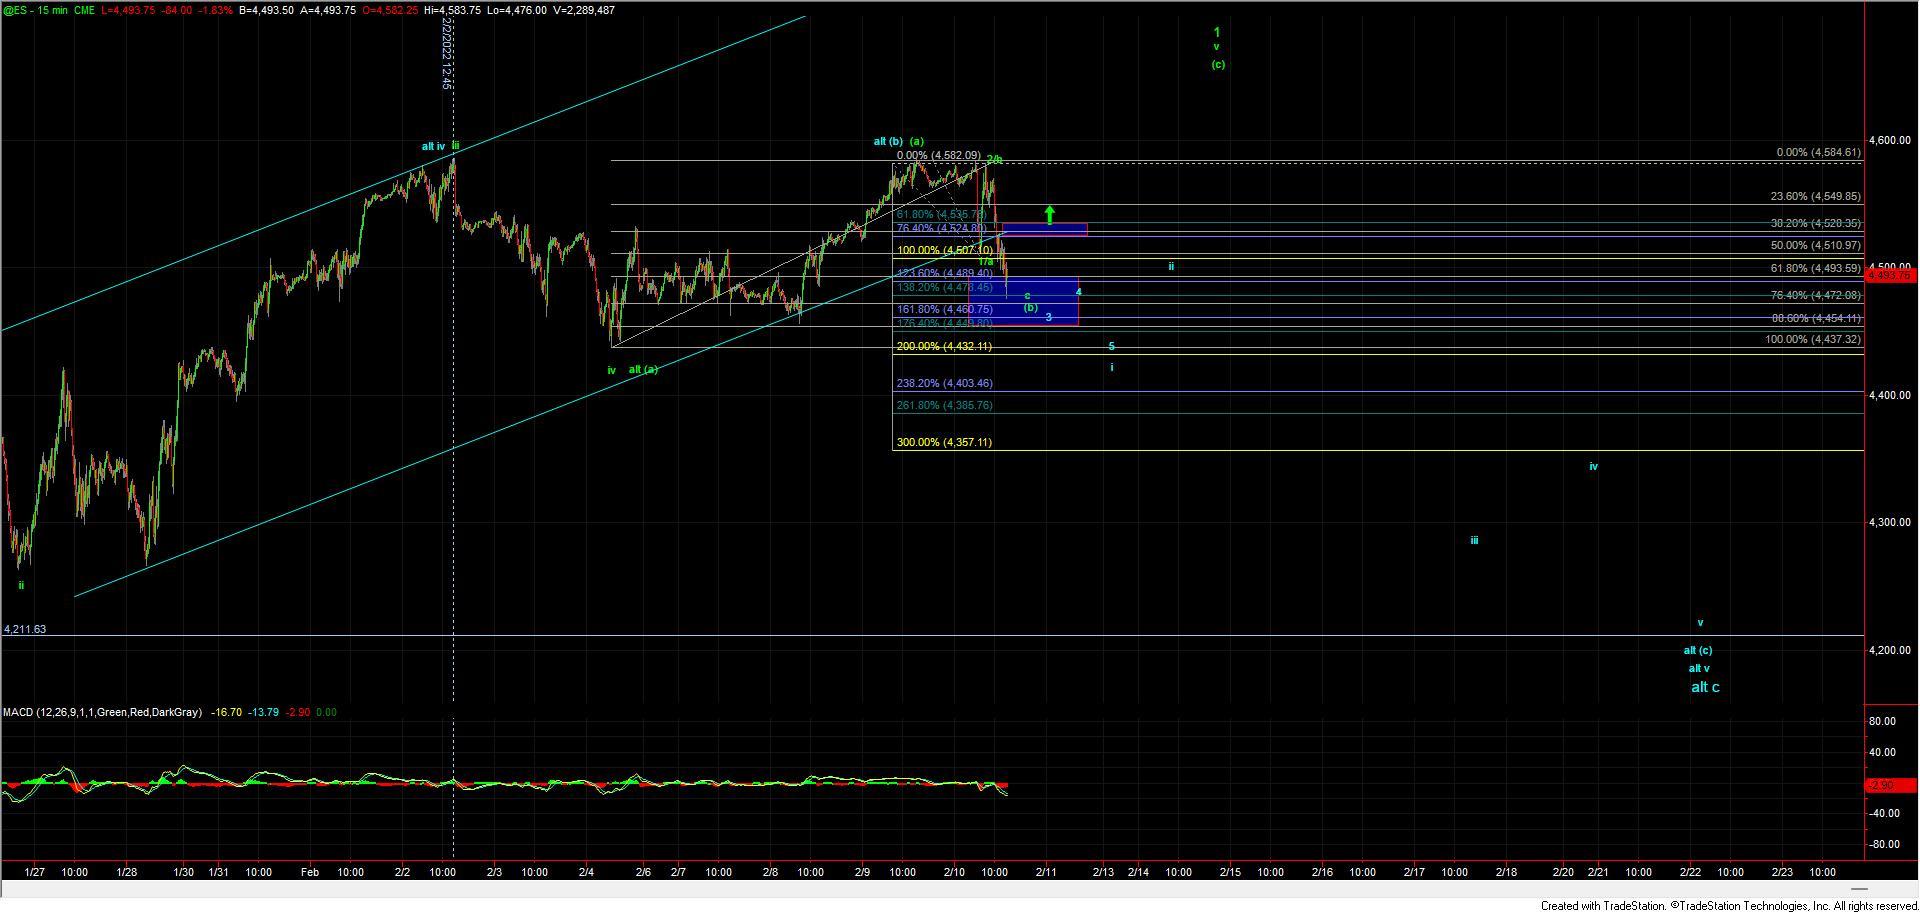
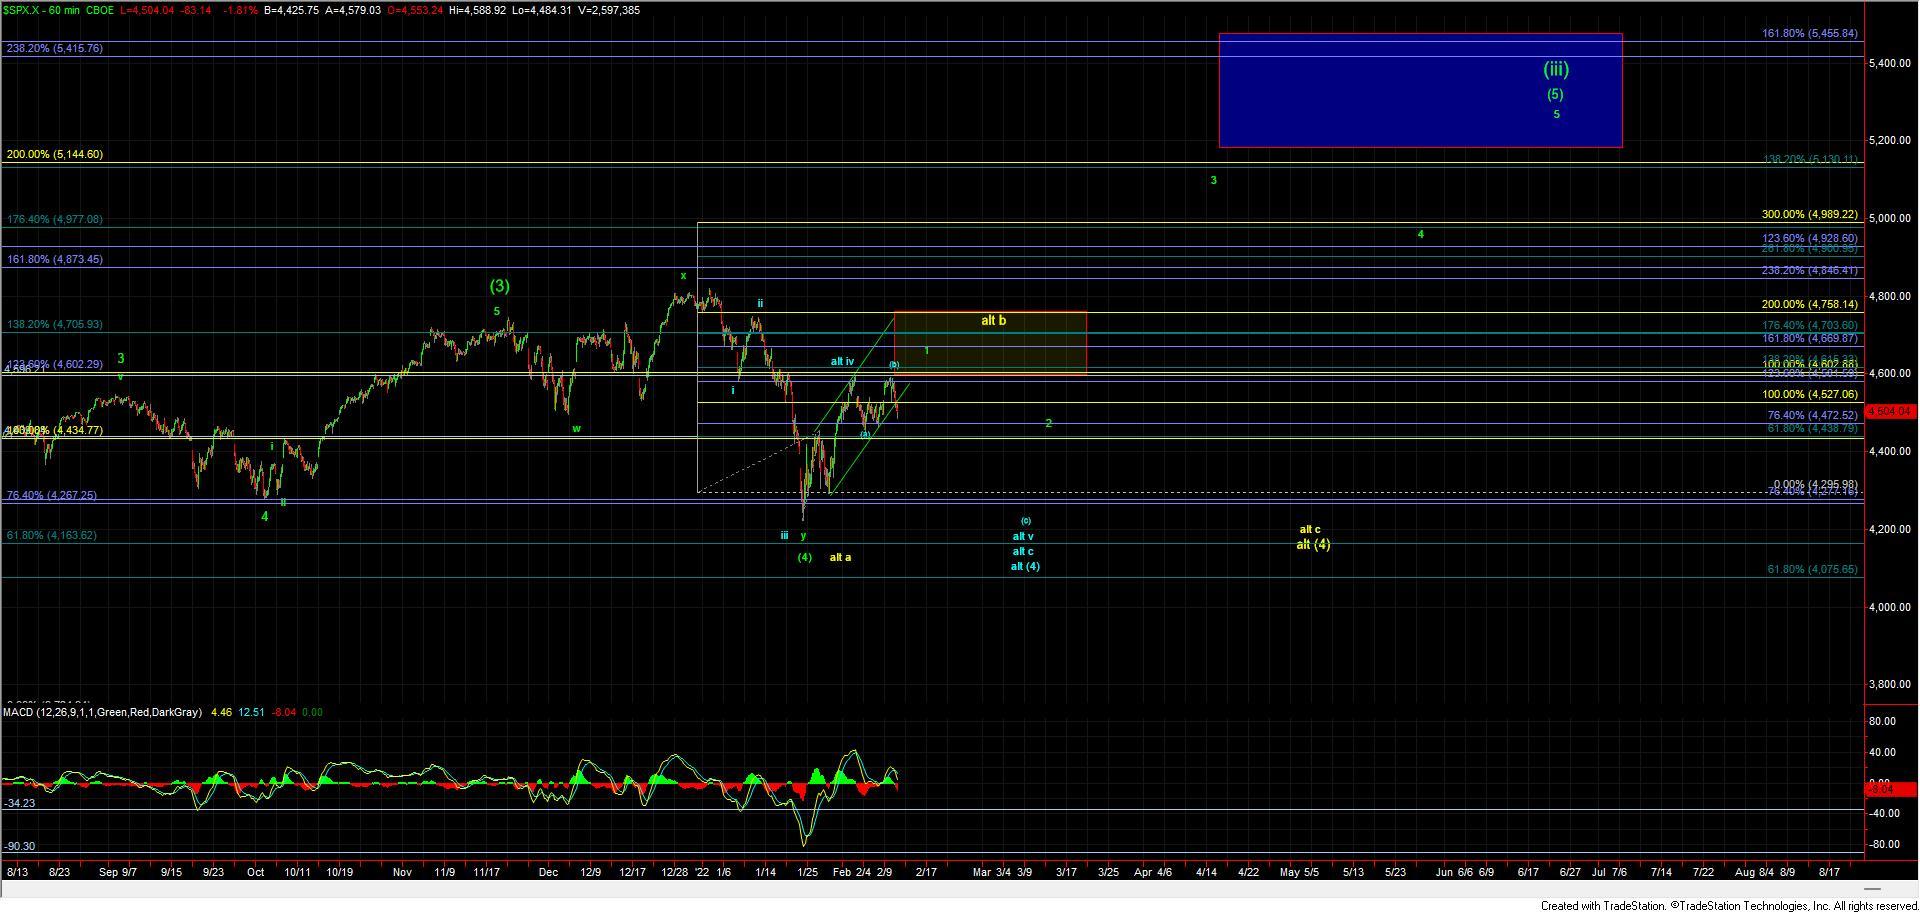
Under the green path, we should be in the final stages of a wave 1 up off of the January lows attempting to finish off the wave v of that wave 1. Because this wave 1 is likely taking the form of a leading diagonal all of the subwaves of this move are corrective in nature, thus making it more difficult to accurately track the smaller degree price action thus giving us the whipsaw environment. Zooming into the ES chart I currently have support for this green count coming in at the 4472-4454 zone and if we indeed going to see this push to new highs this is the zone that should hold. We would need to see a full five up followed by a break back over the 4524-4535 zone to signal that we have put in a bottom in this green wave (b) and that we have begun the final wave (c) of v up to finish off the wave 1. After topping in the wave 1 then we would be looking for a larger corrective retrace for a wave 2 which should take us back down under current levels before finally being ready to break out in the larger wave 3 of (5) up into the 5200-5500 zone on the SPX.
If we fail to hold support as noted above then it would give us the initial signal that we are following through under the blue count which again would ultimately take us back down to a new low under the January low before finding a bottom in that wave (4). Under that blue count along with breaking support, I would need to see a full five-wave move to the downside which I have laid out on the ES chart. This five-wave move should take us down towards the 4432-4403 zone before retracing higher in a wave ii before seeing a breakdown for a wave iii of larger wave (c) down. Again at this point in time, I still am of the opinion that the structure down off of the highs is more supportive of the green count so as long as we are trading over support this blue count will remain my alternate count.
The yellow count is unchanged from yesterday's update and would suggest that rather than this move up off of the January lows being a leading diagonal for a wave 1 we are instead seeing a larger wave b of (4). Under this yellow count, we should see a push higher up towards the 4700 area which would then be followed by a larger wave c of (4) down back towards the January lows before finding an ultimate bottom. As of right now, the structure is not terribly supportive of this yellow count but if this does continue to extend towards the 4700 area and beyond it may become a more likely scenario. For now, however, it will simply remain an alternate count and I will look towards the green count as the primary path forward.
Overall this action is still quite sloppy and is likely going to remain that way for the next several weeks. As long as we continue to see corrective wave structure, patience and nimbleness are going to be the name of the game here. For most however taking a step back and focusing on the big picture is going to be the best course of action.


