Slight Change In Perspective – But, Still Looking For A Rally
I want to be clear that the crux of this analysis is based upon the green count, and “assuming” that we will get a 5th wave higher in SPX. But, that does not mean you must trade that aggressively, as there is no guarantee that we get that 5th wave higher high. But, I wanted to point out up front the perspective of the analysis.
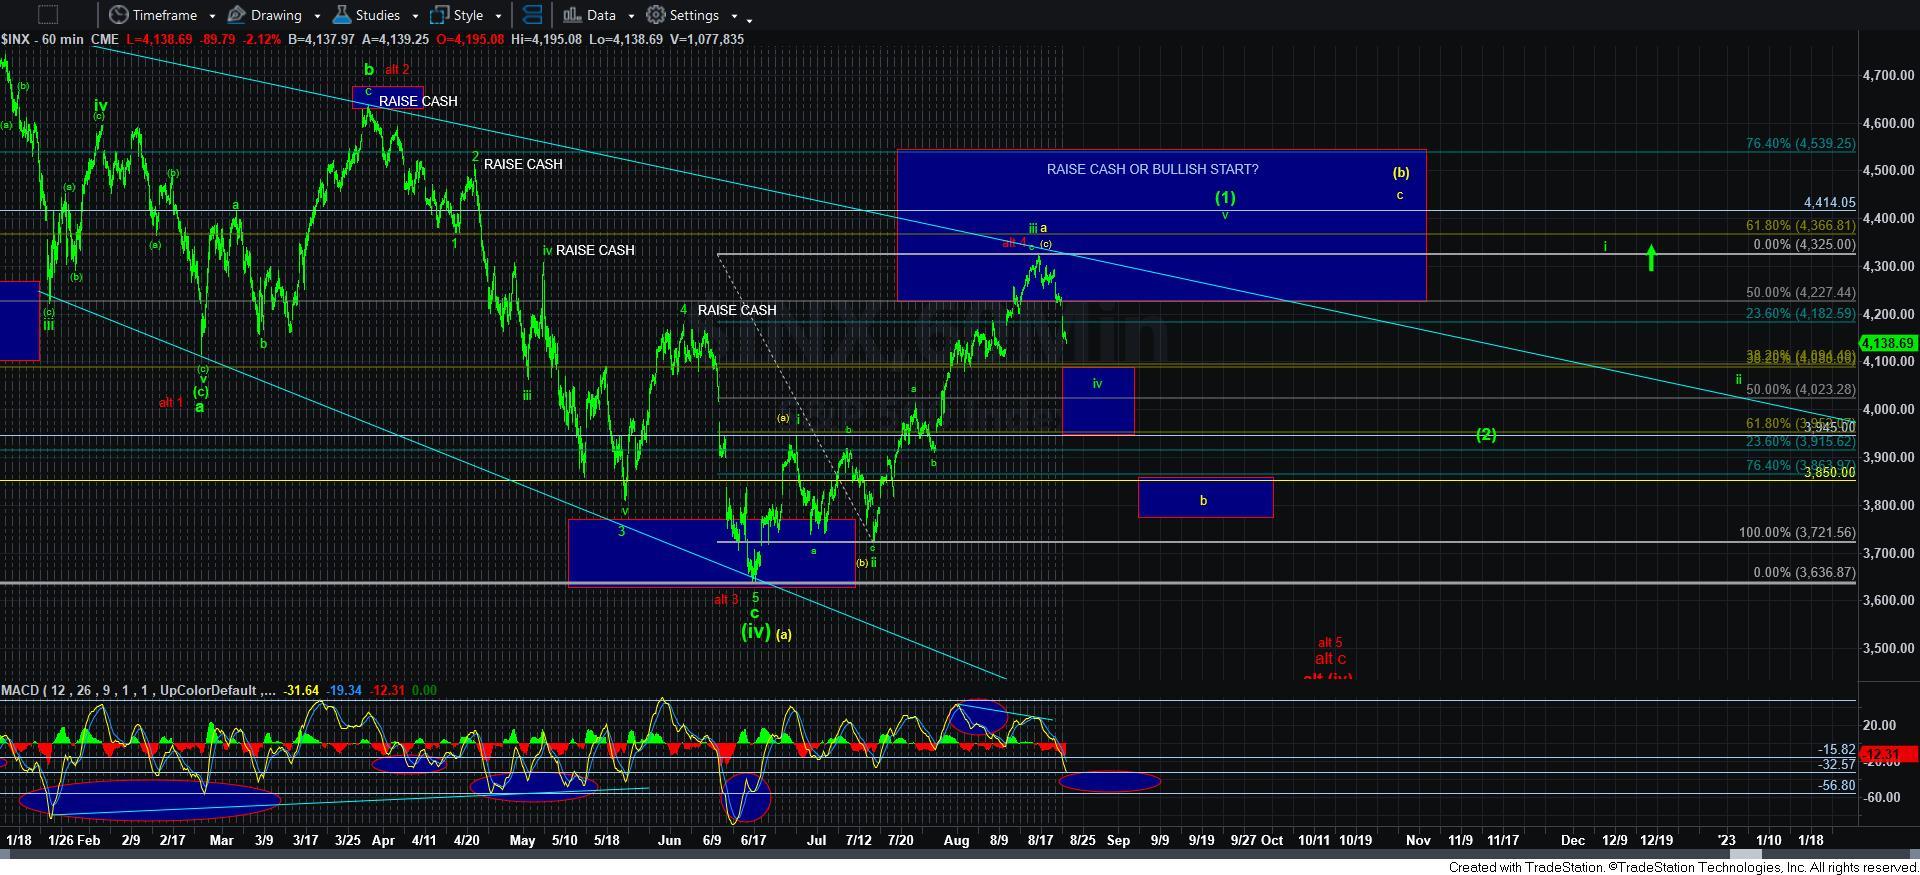
Before we began this pullback, I noted that the theory of alternation would suggest that the wave iv drop would be a sharp decline. Moreover, that would also do well to reset the MACD on the 60-mintue chart to support another rally to higher highs. But, when the market began in a meandering manner, I moved towards a more protracted a-b-c structure. As far as my initial abandonment of the theory of alternation, well, it is similar to the pirate code in Pirates of the Caribbean – its more of a guideline than a rule.
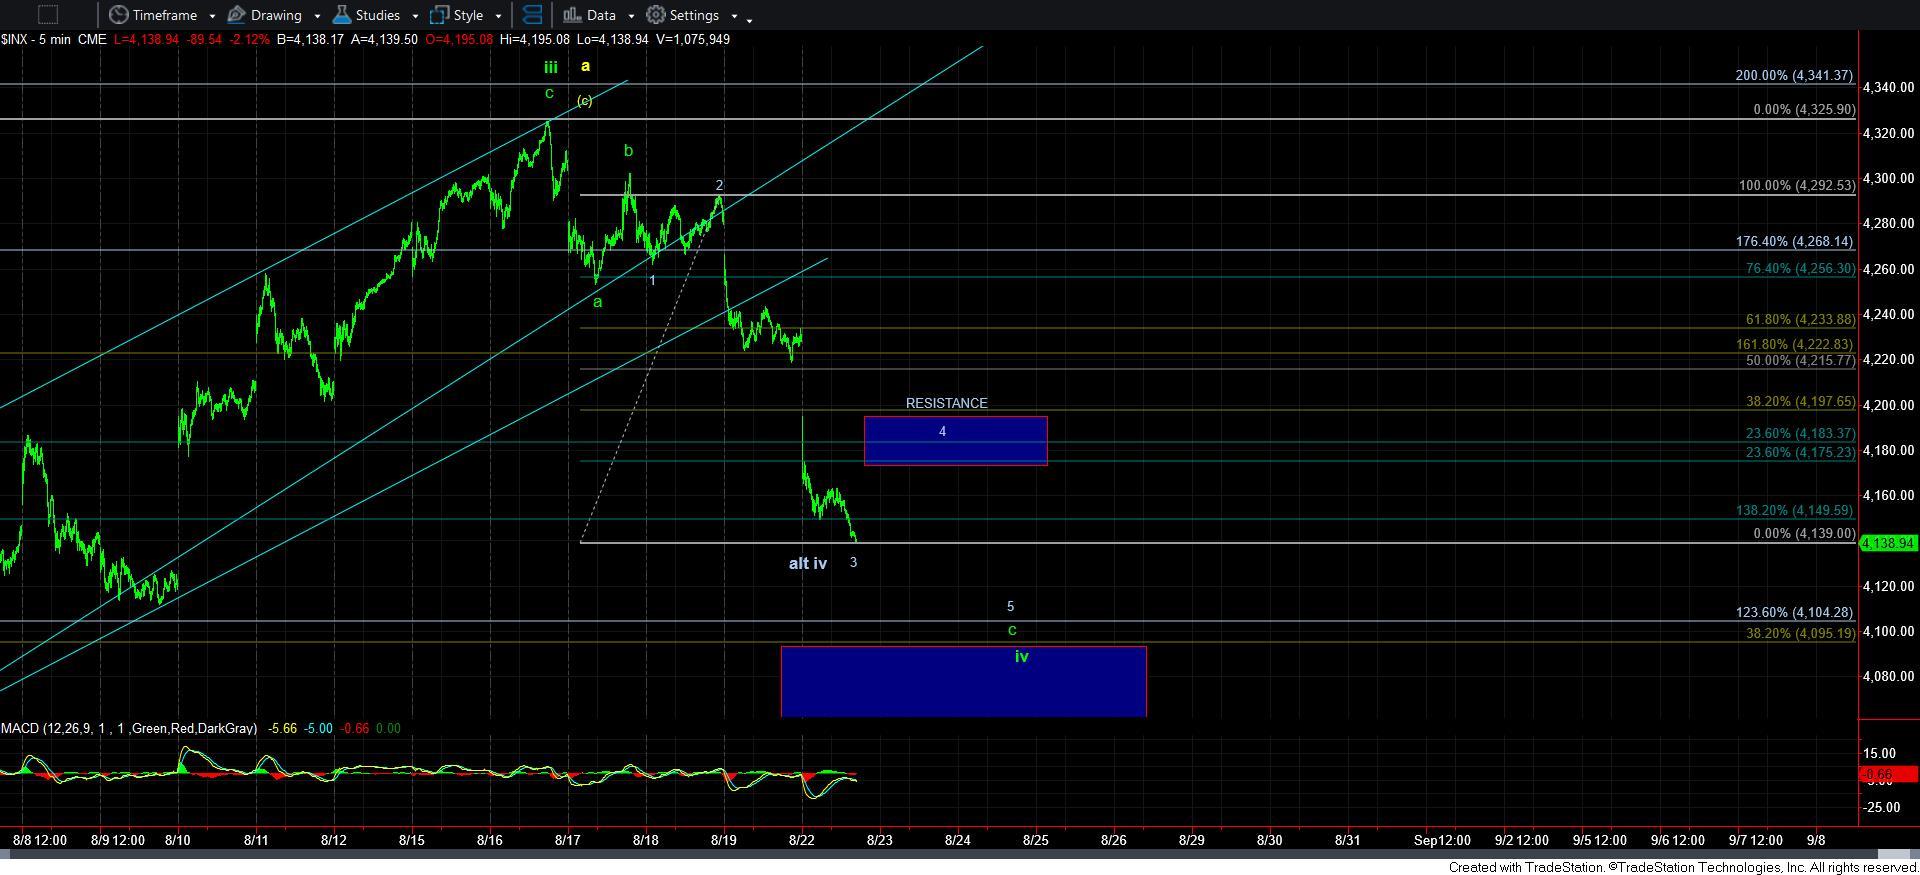
So, when we broke down below the 4180SPX region of support today, that was a warning that the market may indeed attempt to provide us with the sharp wave iv decline that was suggested by the theory of alternation.
Now, I have to determine if this decline from the Friday consolidation is the 5th wave of the c-wave of wave iv, or if it is an extension in the 3rd wave of the c-wave of wave iv. I am siding with this being an extended 5th wave in the 3rd wave of the c-wave since it makes more sense as such from a wave structure perspective. Moreover, if we get a 4-5 as shown per my primary count on the 5-minute SPX chart, it will allow us to get even closer to our ideal target for wave iv in the 4100SPX region.
Our current upper resistance for a 4th wave bounce is the 4198SPX region. Should we continue to extend in wave 3, then that resistance will be lowered, as it is the .382 retracement of wave 3, which is the standard expectation in for a 4th wave. But, note that the .236-.382 is our resistance region, as this 4th wave could come up short to give us more room to strike the 4100SPX ideal target. Alternatively, should we see a sustained break out over 4198SPX resistance, then I will view us as having begun wave v towards 4400+, and my alternative count will be that the rally is a b-wave, which will maintain below the recent high struck in wave iii. (I will also note that if we do get a b-wave rally, then the probabilities for the yellow count begin to increase).
Also of note is the MACD on the 60-minute chart, which is now striking the target zone for a reset. This is the region at which I would expect it to bottom if the market is indeed going to make an attempt to a 5th wave higher high.
As far as targeting for a 5th wave, we often see equality between waves i and v. Again, this happens often, but it is not a set rule. Since wave i was just a bit more than 300 points, it would allow me to reasonably expect that wave v can target the 4400+ region.
So, my primary count remains green, and I have adopted the wave count that we are completing the c-wave of wave iv a bit sooner than I had initially expected this past weekend. After all, 4th waves can take many different twists and turns. Yet, I am still expecting that rally to begin this week, but it MAY take a few more days to complete the 4-5 if that is the market’s intention.