Simply Relentless - Market Analysis for Oct 18th, 2017
Traditionally, markets do not rally without some pullbacks, just like trees just don’t grow to the sky. But, with the manner this market has been relentlessly grinding higher, I started looking out my window to see if my trees are approaching the clouds.
Over the last several weeks, the market has had ample opportunity to provide some kind of pullback, but has failed to follow through on each set up. This is what happens during a 3rd wave. And, this one has certainly seen its share of extensions.
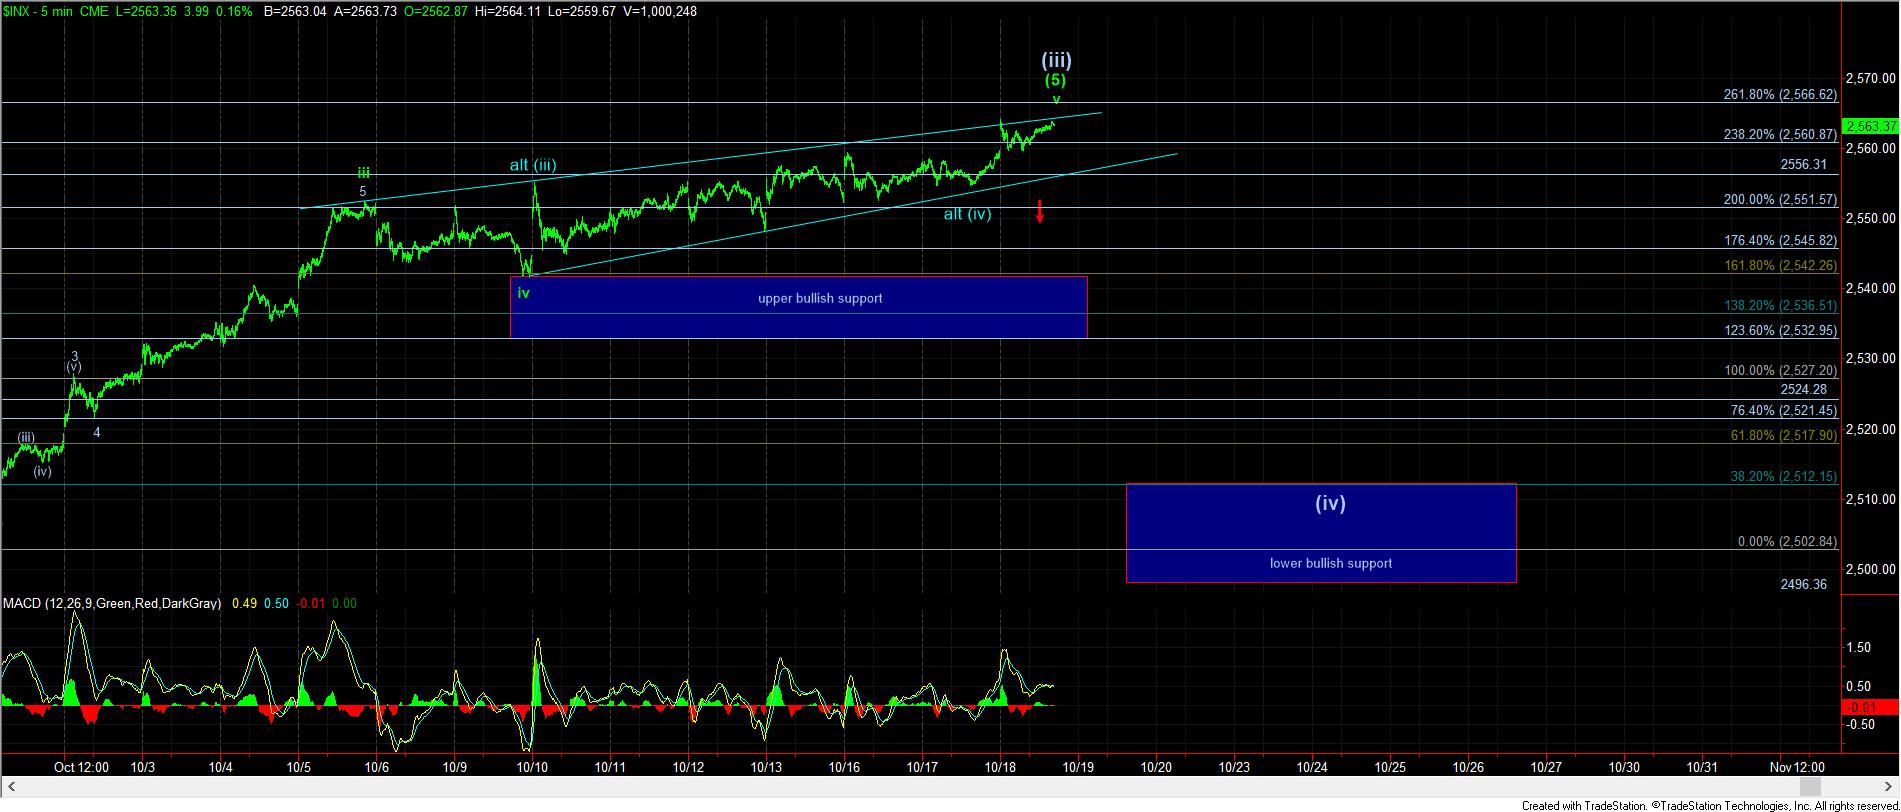
As we stand today, we have another micro “topping” potential, with what is normally viewed as an ending diagonal, as completing grey wave (iii). Ending diagonals are different than standard impulsive structures as they overlap while they continue in the primary trend. That is what my primary perspective suggests we are completing right now.
One of the hallmarks of an ending diagonal is that, once it completes, it reverses quite strongly back down to the point from which it began. In our case, that is the 2540SPX region. But, we need to see a break down below the uptrend channel to suggest this ending diagonal has completed. That is the 2555SPX region at this time. Should we see that type of action, then it would be our initial indication that grey wave (iv) is in progress. Moreover, due to how extended we have become, the .382 retracement of wave (iii) (most common target for a 4th wave) now sits just below the 2520SPX region.
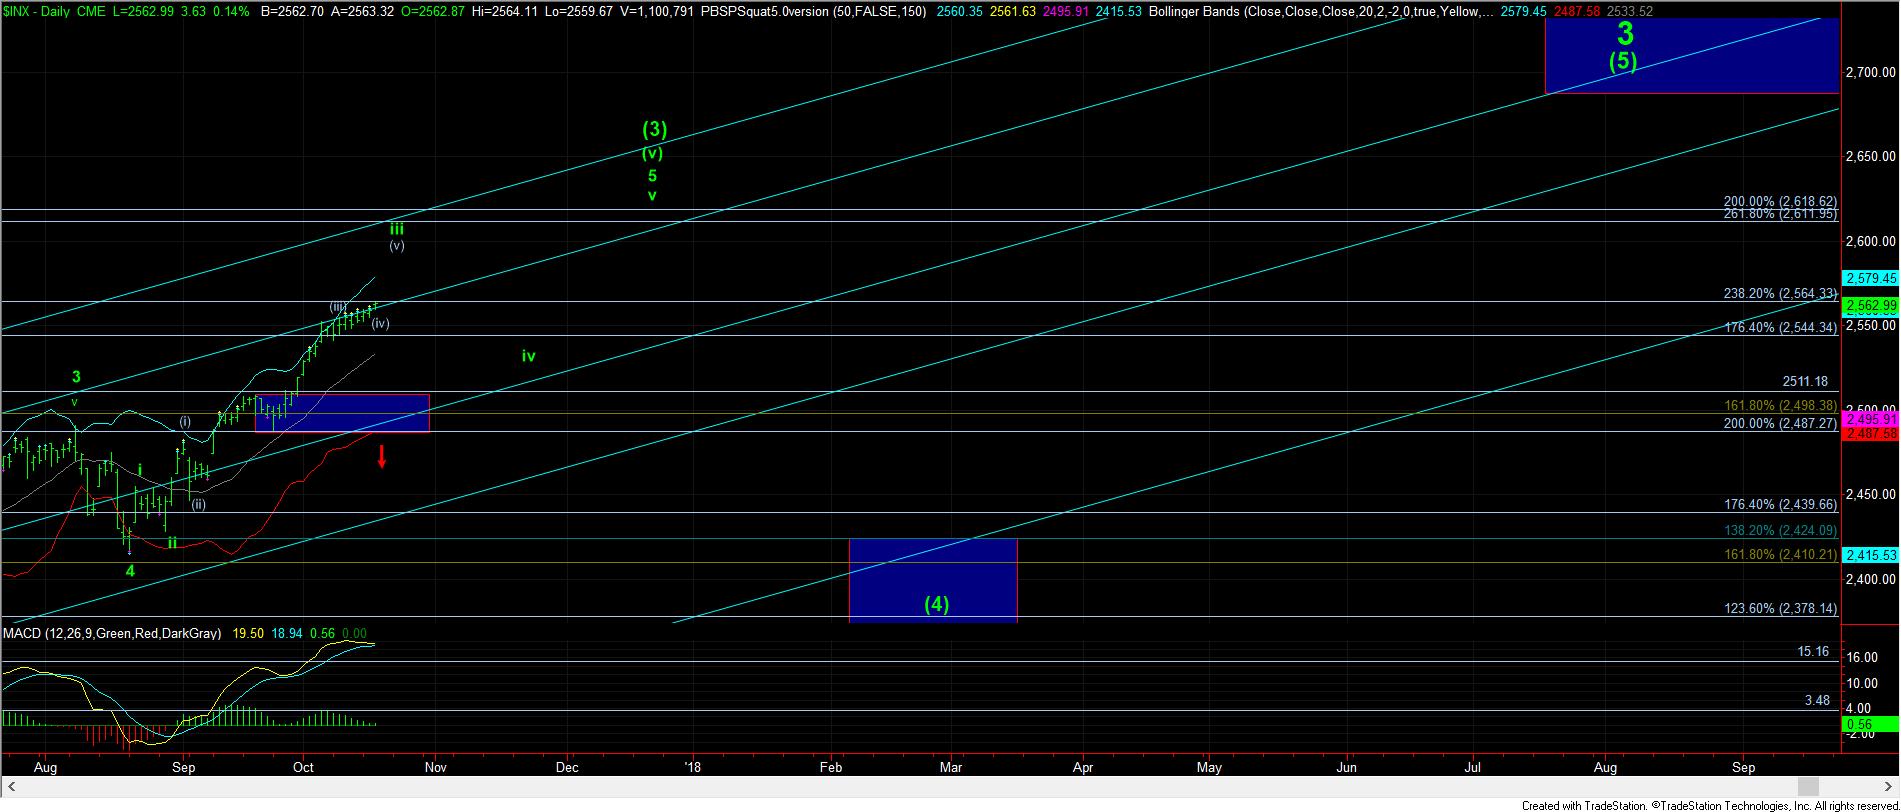
Based upon the overlapping nature of this last move higher over the last week, my alternative wave count would consider wave (iii) as having completed a week ago, with this overlapping structure being what we call a “running triangle” for wave (iv). We simply are unable to distinguish between the two structures, since they are both overlapping structures that continue in the same direction of the main trend. Normally, I would adopt the more immediately bullish perspective in a bull market, but running triangles are quite rare, which is why it is my alternative count at this time.
In summary, our resistance resides between 2564-2567SPX. As long as we remain below that resistance, I am viewing us as completing an ending diagonal, which is presented on my 5 minute chart. However, if the market can break out strongly through resistance, I will have to adopt the running triangle potential, which I have presented on the daily chart. But, for now, I am going to maintain the ending diagonal potential, which the market is going to have to prove to us within the next 24 hours, or else all we are doing is setting up to rally much higher, sooner rather than later.
At the end of the day, we are still on target to approach the 2611SPX target region by the end of the year. But, I would much prefer to see a standard wave (iv) before we continue that trek higher. Yet, the market really does not care about what I “prefer,” so we have keep an open mind for clues the market wants to continue to relentlessly melt up during this wave iii.