Signs Still For Another Potential Rally
With the SPX just griding up and down without much of a reliable smaller degree pattern, I am presenting other clues I am seeing in other charts.
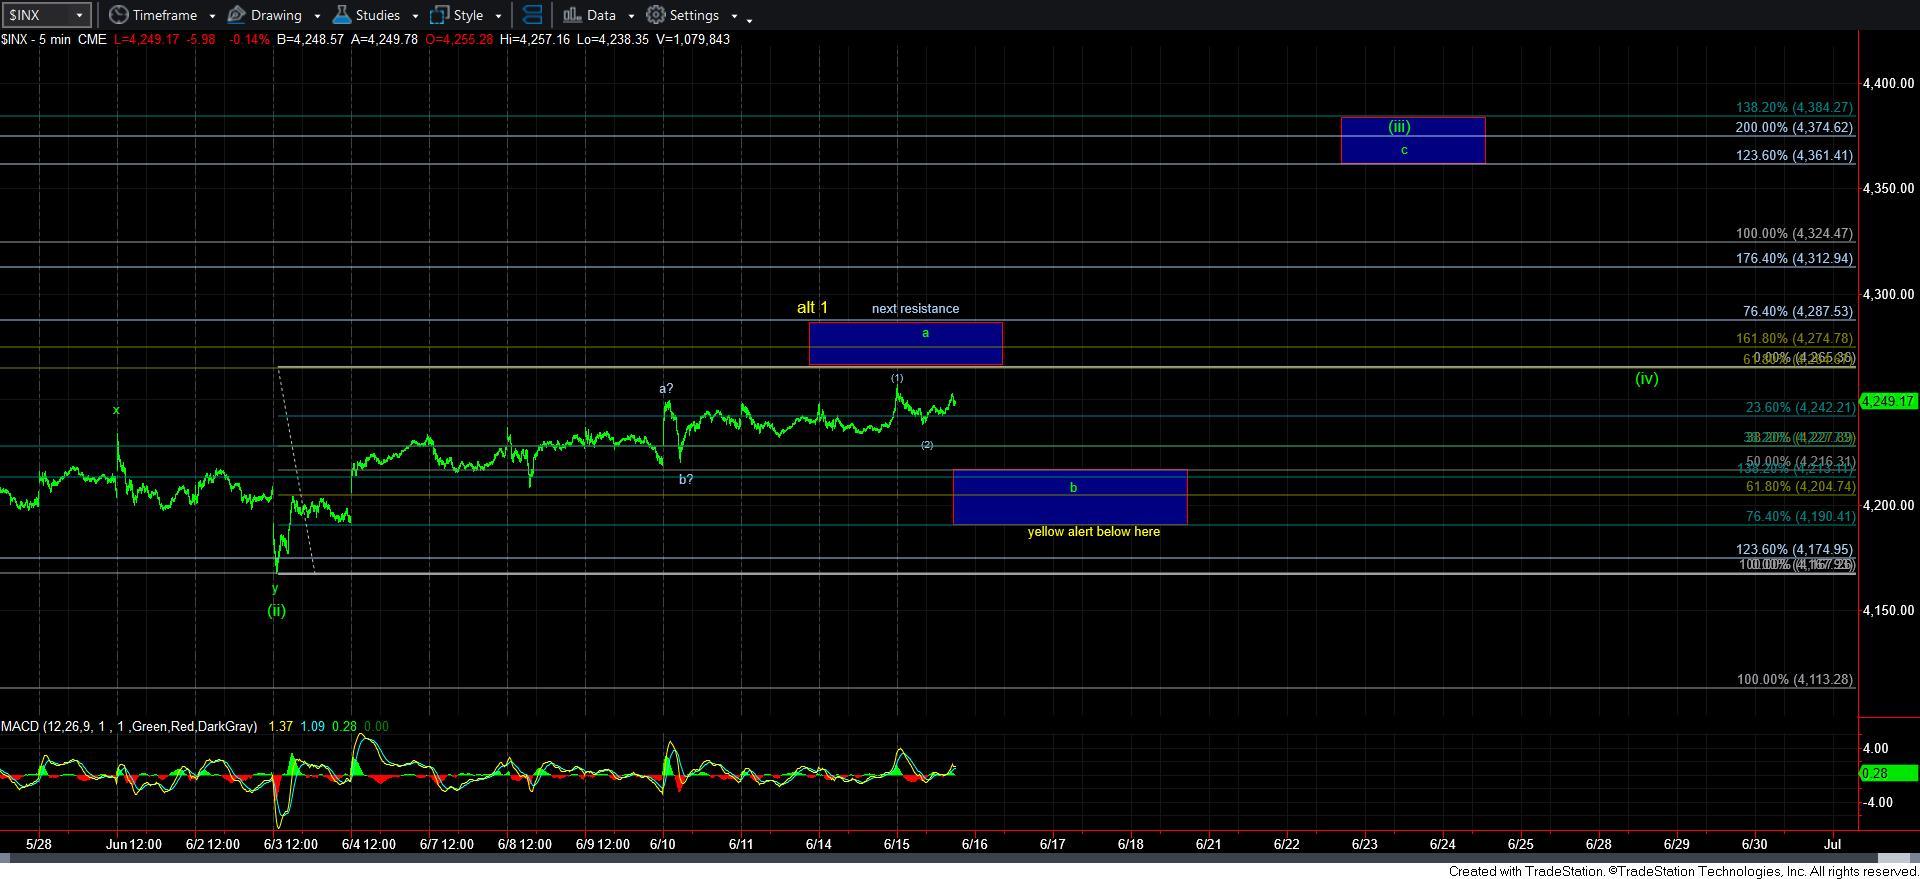
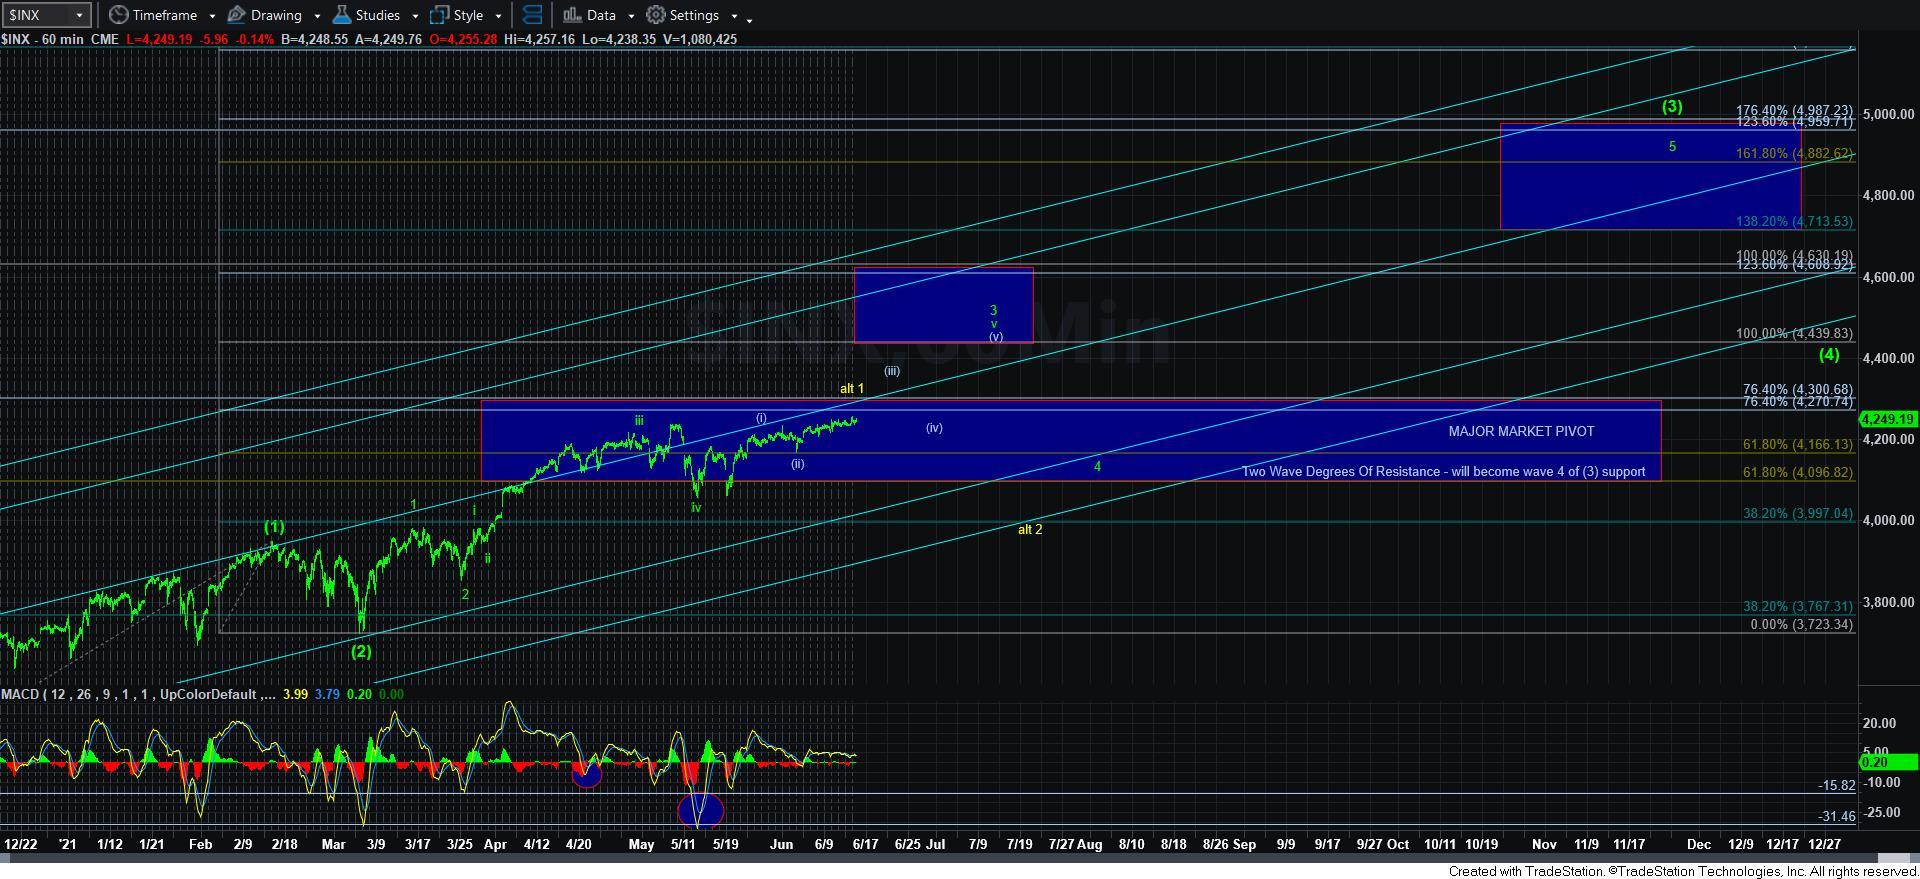
In summary, the SPX is still hitting its hanging out just below resistance, with the 4190SPX region still our main support below. And, until we actually break down below 4190SPX in a sustained fashion, I cannot adopt the yellow alternative count.
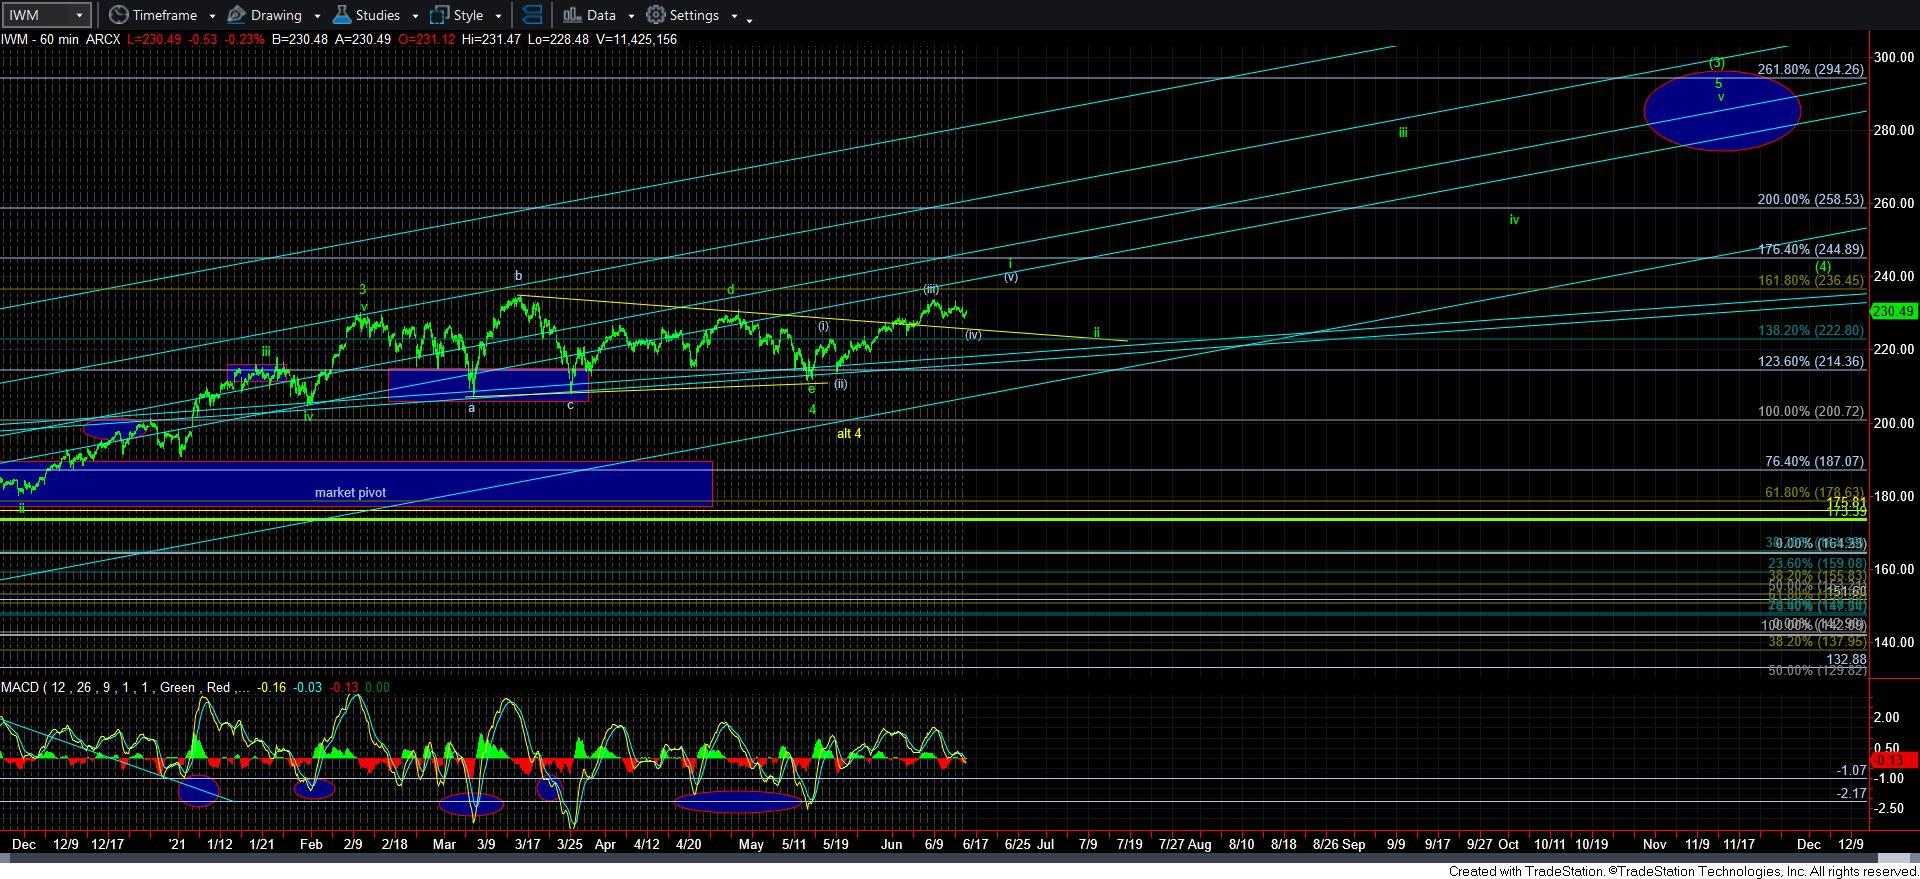
Let’s take a look at the IWM this evening. After completing what looks like a 4th wave triangle, we seem poised to rally higher in a 5th wave to complete 5-waves up off the recent completion of the triangle. This is one of the strongest factors I am seeing for a continued push higher in the equity market. But, keep in mind that this is somewhat limited based upon this wave count, as all we are looking for is a 5th wave to complete before we see another bout of weakness in this chart for a wave ii pullback.
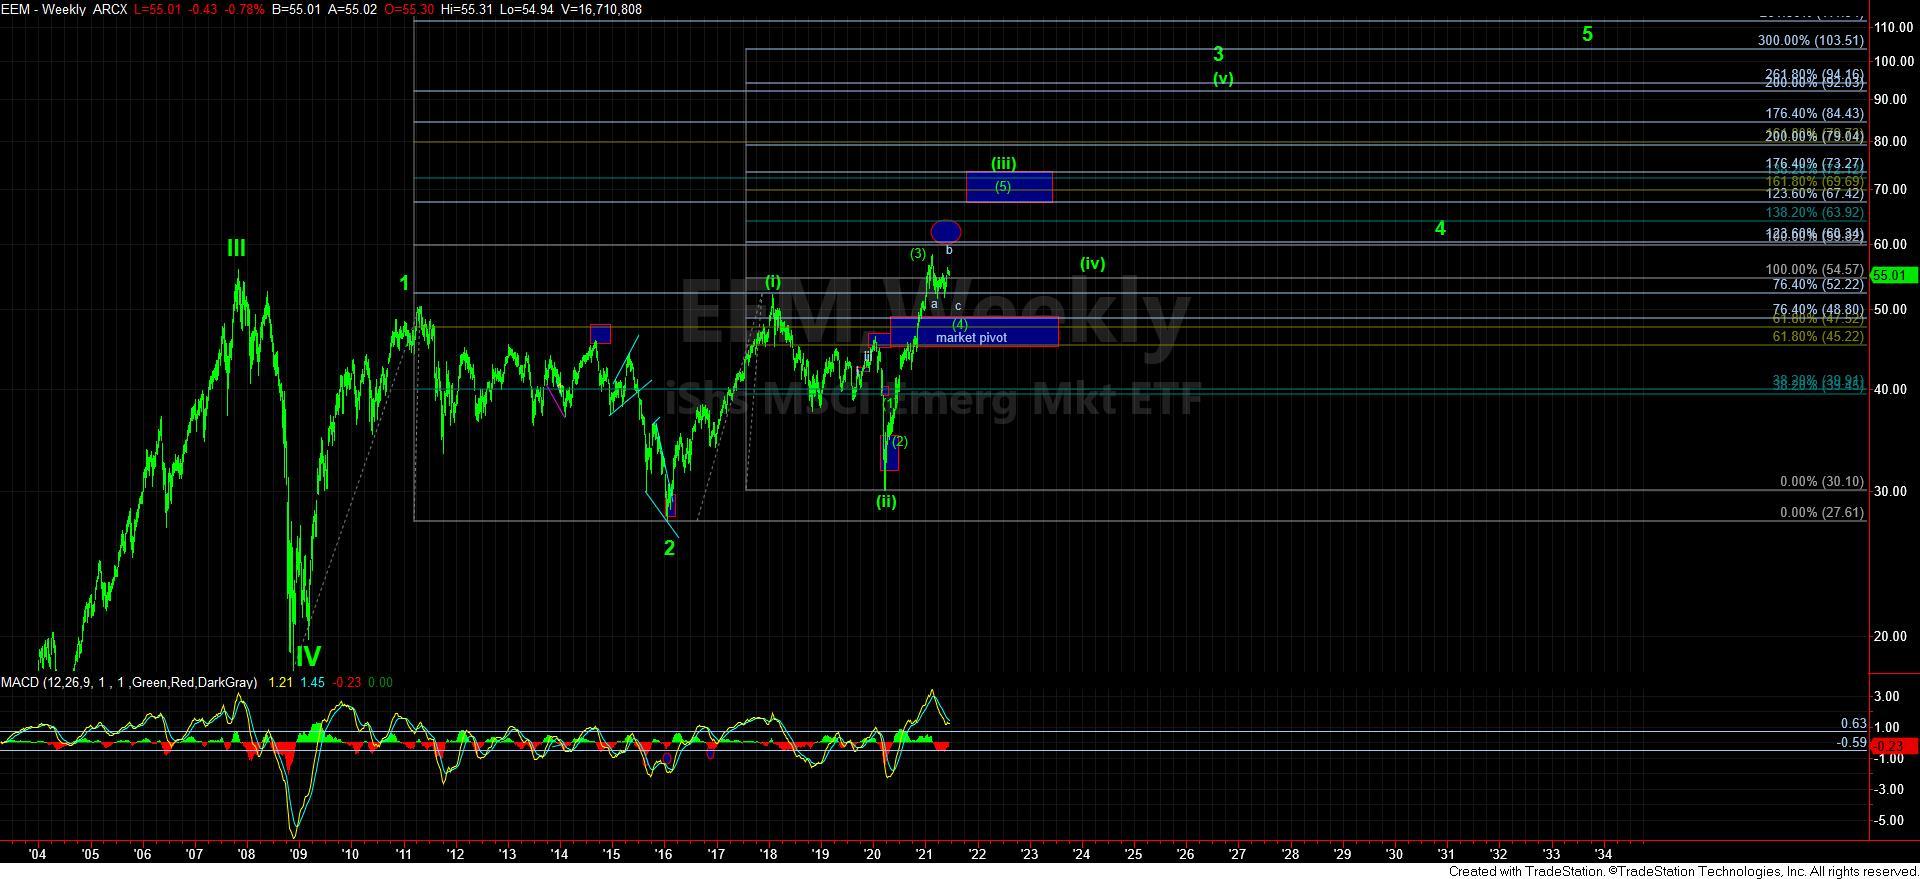
Moreover, I don’t speak about the EEM often (for my last bigger update on EEM see an update I did in August), but it also looks like it may see one more push higher to complete a b-wave in a larger wave [4] I have been tracking. But, this also supports my expectation for weakness in the equity market this summer, as this pattern should see a c-wave decline to complete that wave [4]. What is also interesting about this chart is that it suggests that the weakness I expect over the summer can be a very fast and “scary” event which should shake weak hands out of the market and set us up for the rally into the last half of the year that I still expect.
So, overall, I am still unsure if the 200-300 point pullback in the SPX comes from 4300SPX or if we can extend up towards 4400SPX before we see it. Based upon the need for only one more push higher in the IWM, I may begin to lean towards the yellow count. But, for now, we are still over support, and I have to respect the bull market.


