Sideways For Three Days
Pretty much, the title says it all. Yet, in my opinion, we are still involved in a topping structure. And, the ES is suggesting that this topping structure can still push higher one more time.
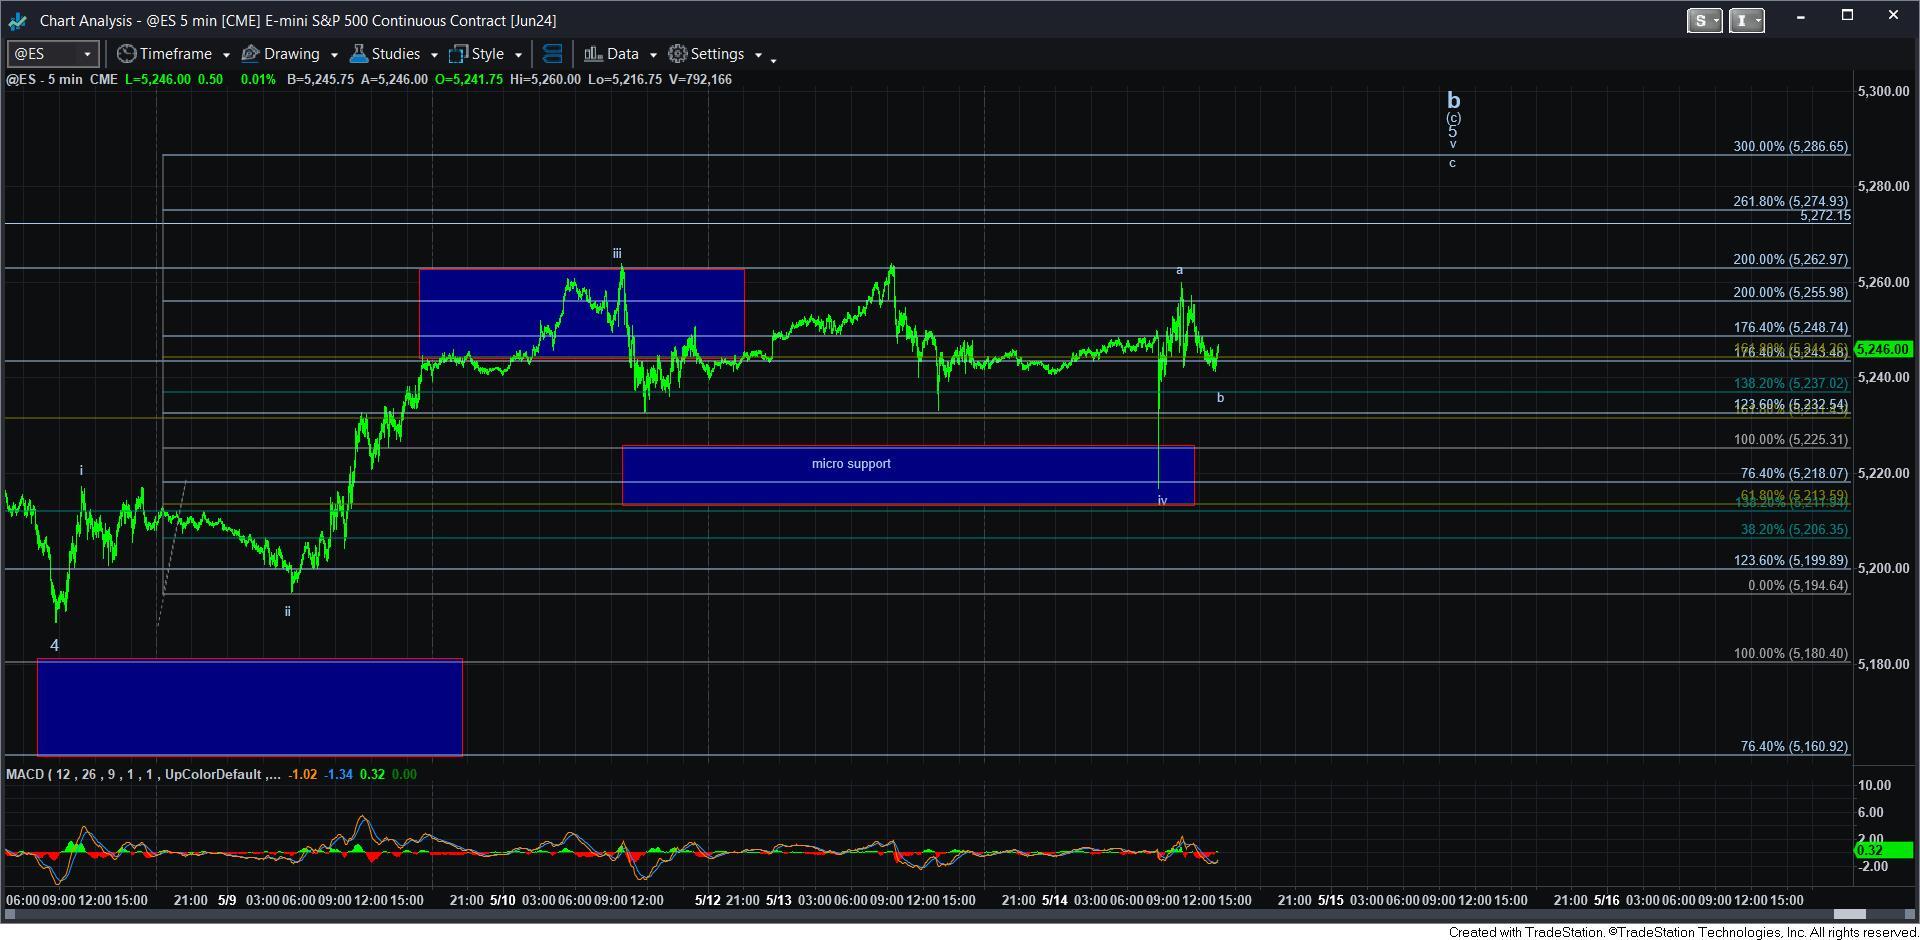
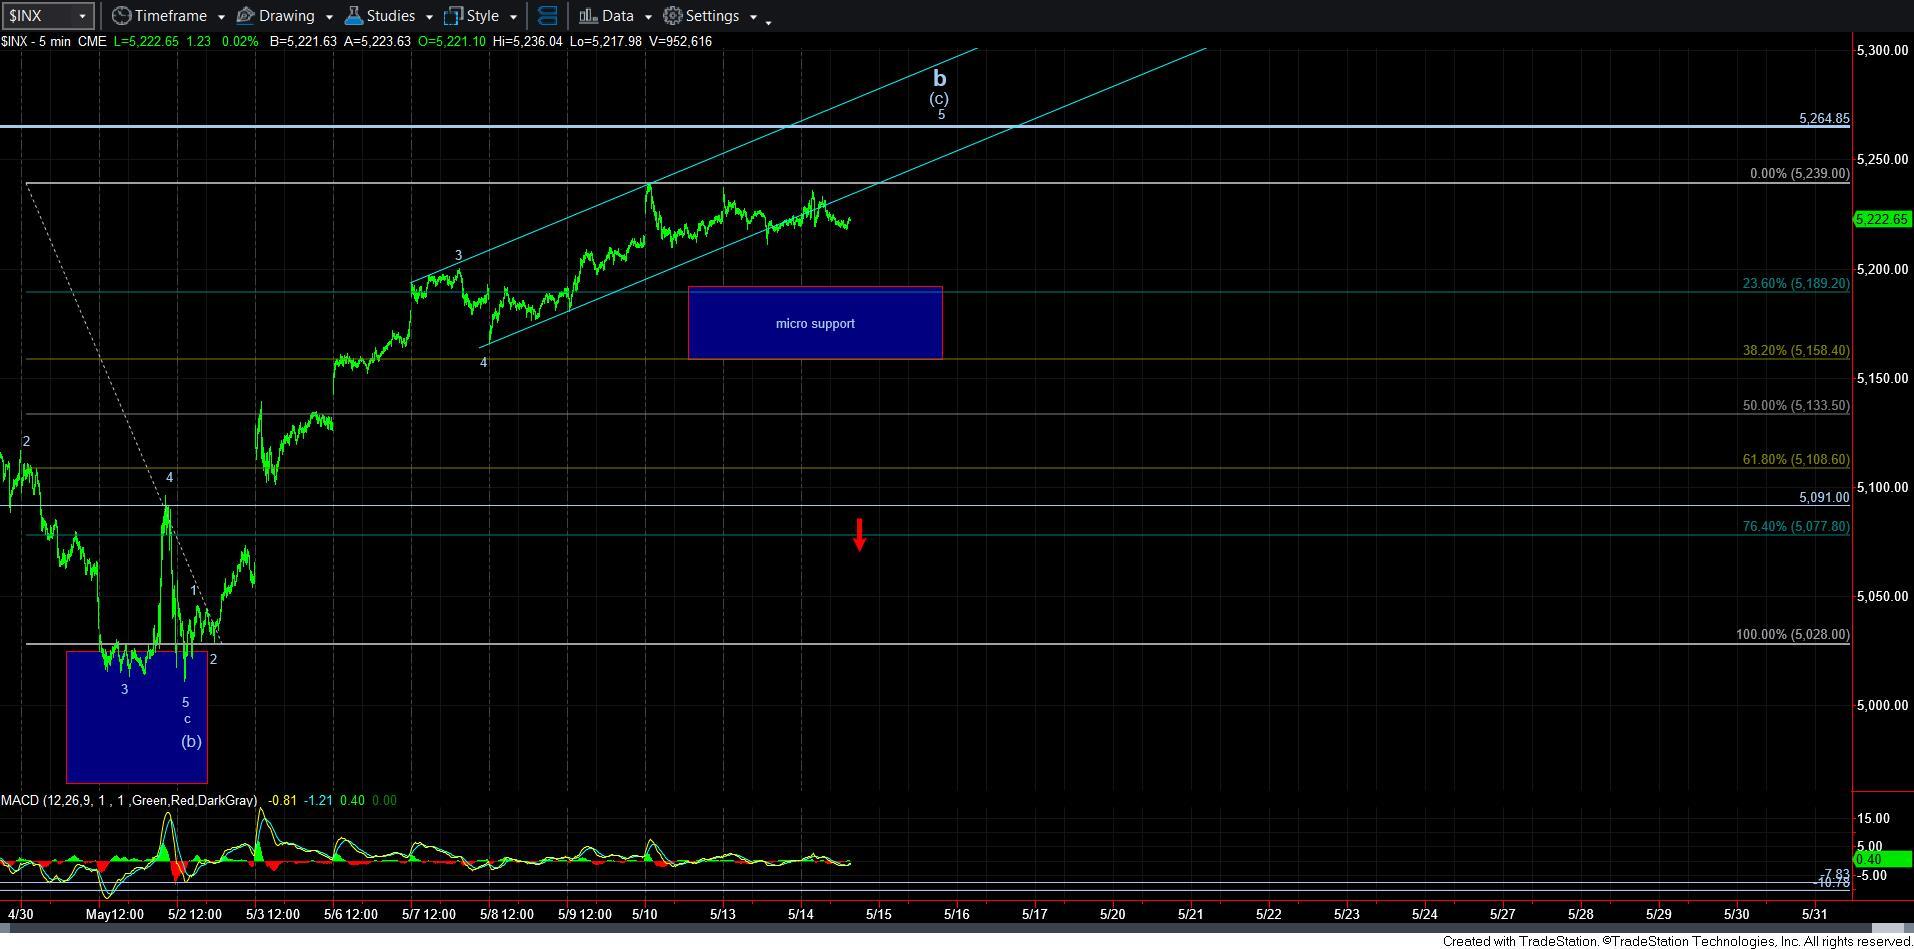
For those that have been in our chat/trading room, you would be familiar with my 5-minute ES chart. As you can see, we recently topped in the box on the left, came down to the support box noted, and we now seem to be setting up for one more push higher.
If you also remember, I noted last week that the structure of wave 5 really counted best as an ending diagonal. Yet, until today, we did not see the standard overlap of wave 4 with wave 1. Today’s spike down pre-market provided that overlap by pennies. So, it would seem that wave iv of 5 completed this morning, and we are setting up potentially for one more rally in the c-wave of wave 5.
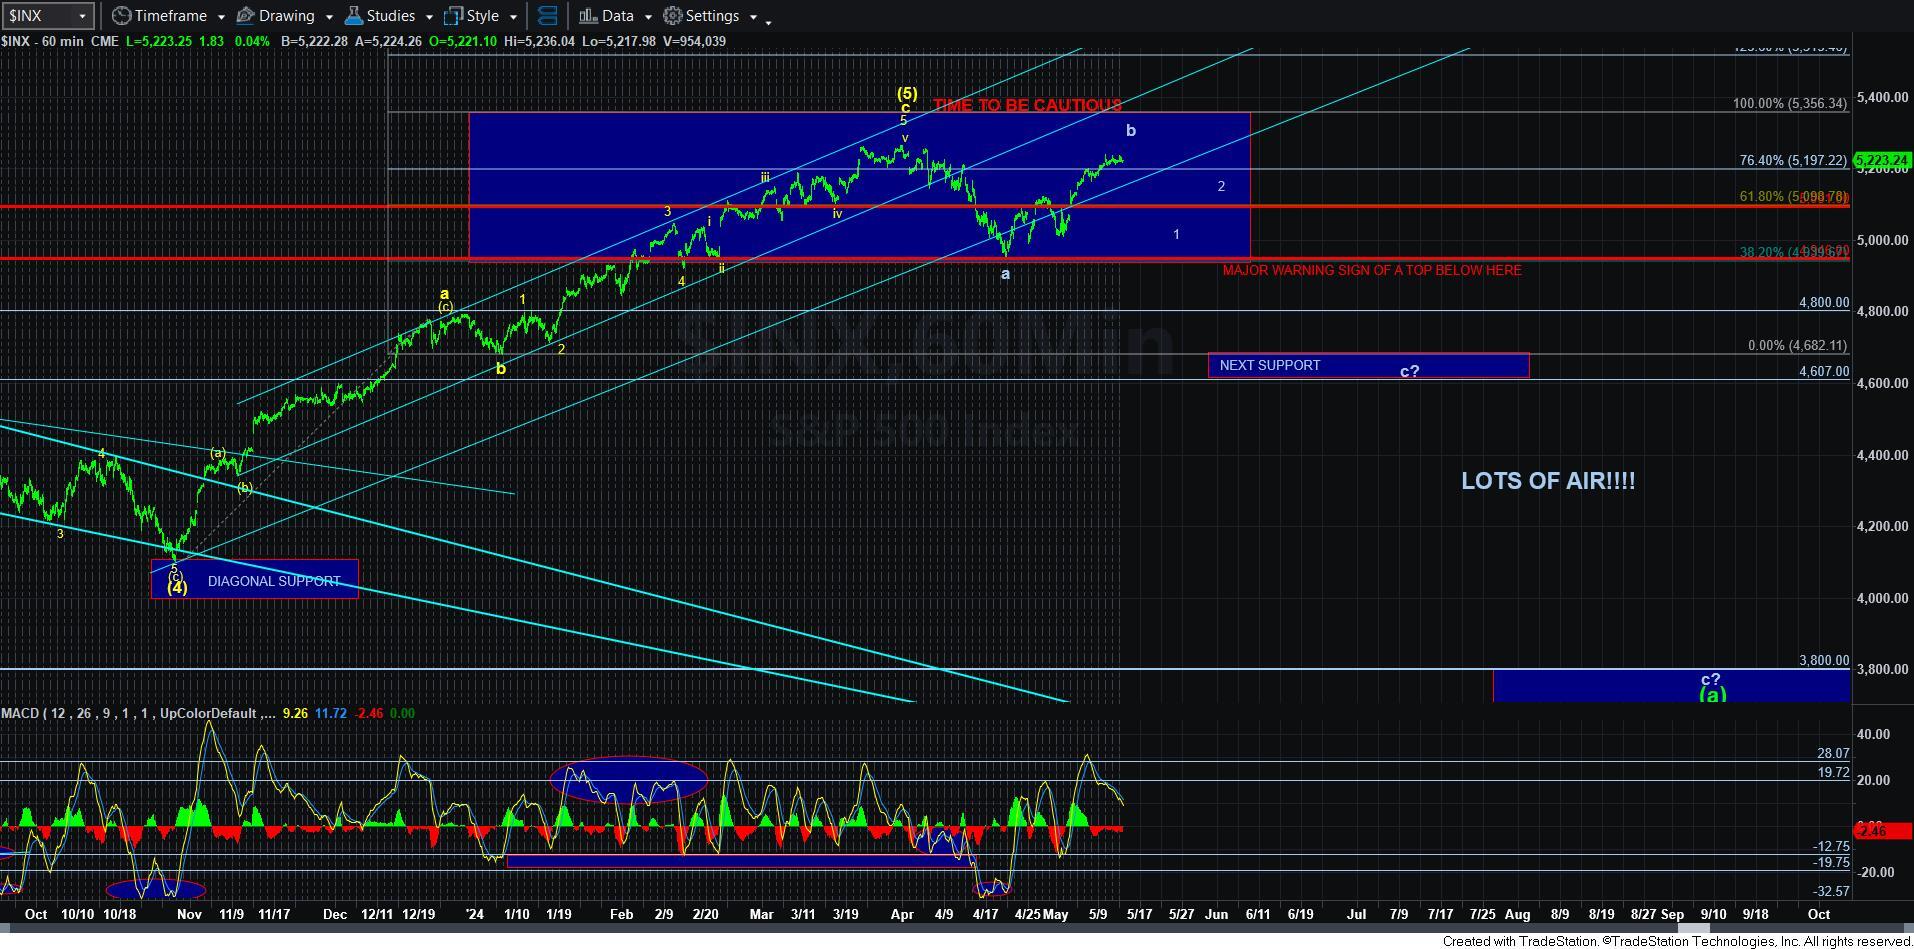
But, I have to note that this structure is quite full for the [c] wave of the this b-wave rally we have been tracking. However, without any indication that we have actually topped (in other words, I still do not have a clear 5-wave decline), I have to assume the market wants to push higher one more time.
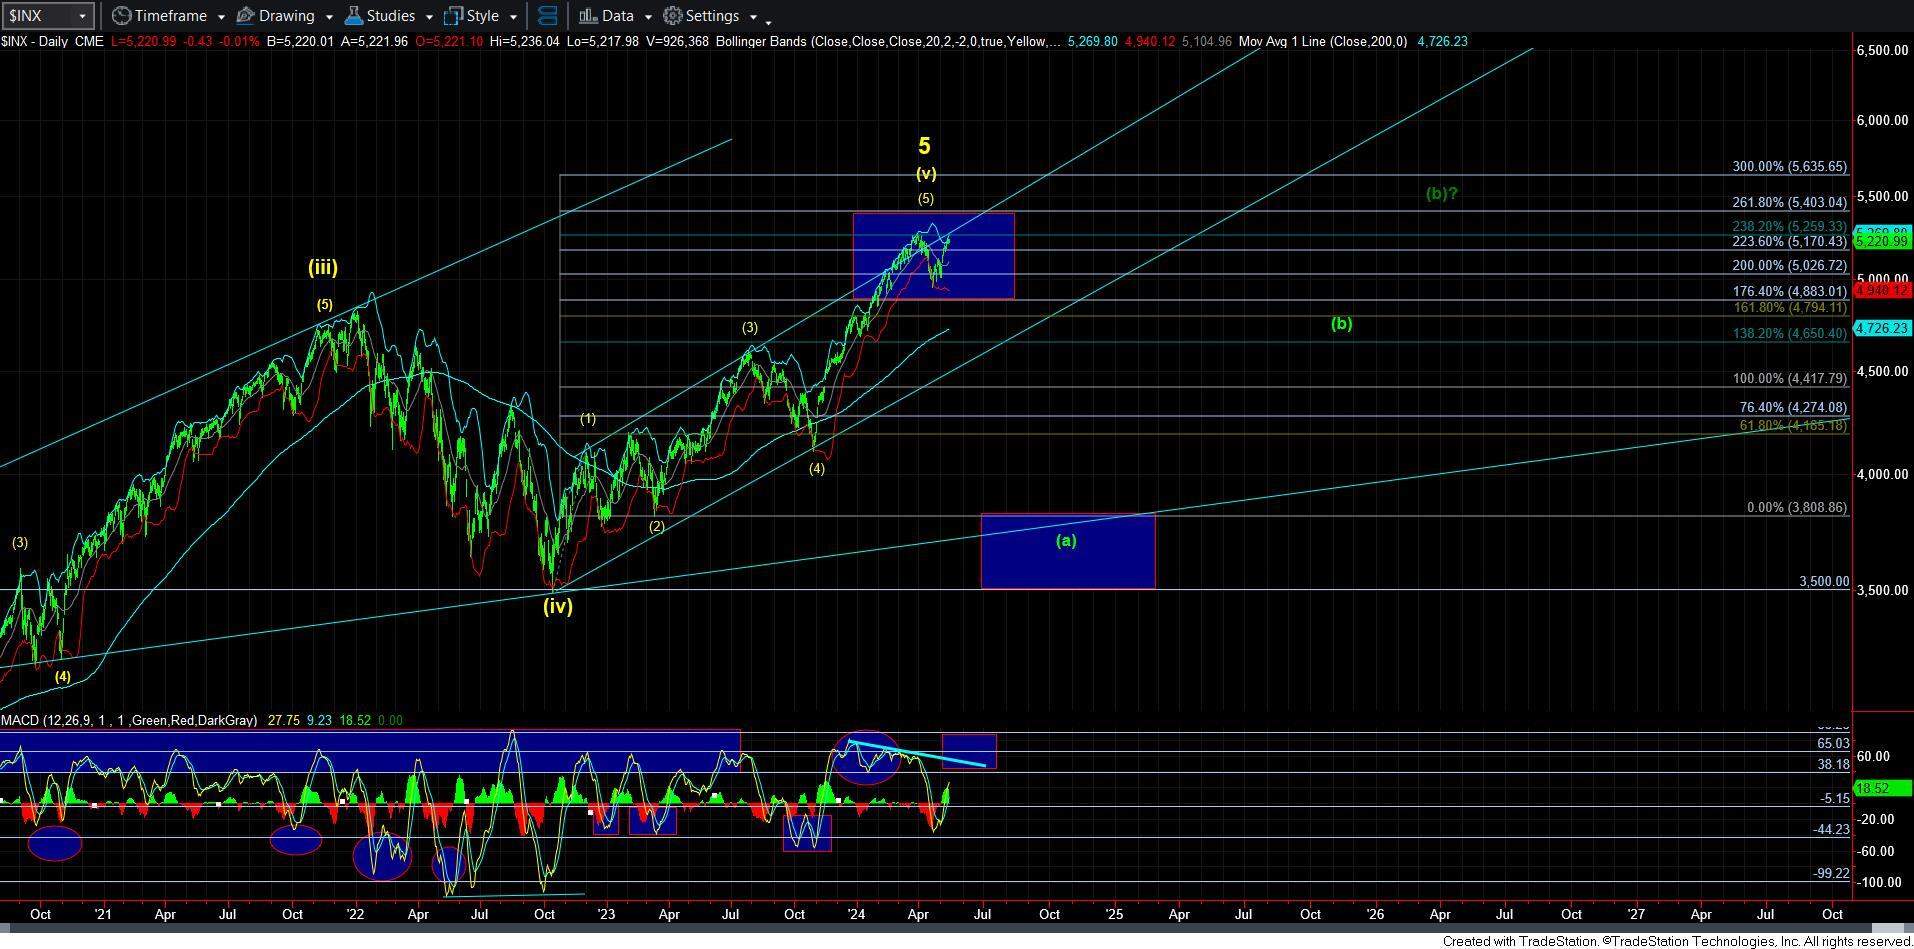
I also noted something interesting on the daily chart. As you can see, we are now coming back to test the longer-term trend channel, as well as the MACD now bouncing back towards resistance.
So, while the market is still suggestive of attempting to complete a b-wave rally, I am still going to caution against getting bearish until we see a 5-wave decline below 5155SPX. Should we see that wave structure, then I will begin to turn bearish. Until that happens, I remain EXTREMLY cautious.