Setting Up To Test The Support Box Below
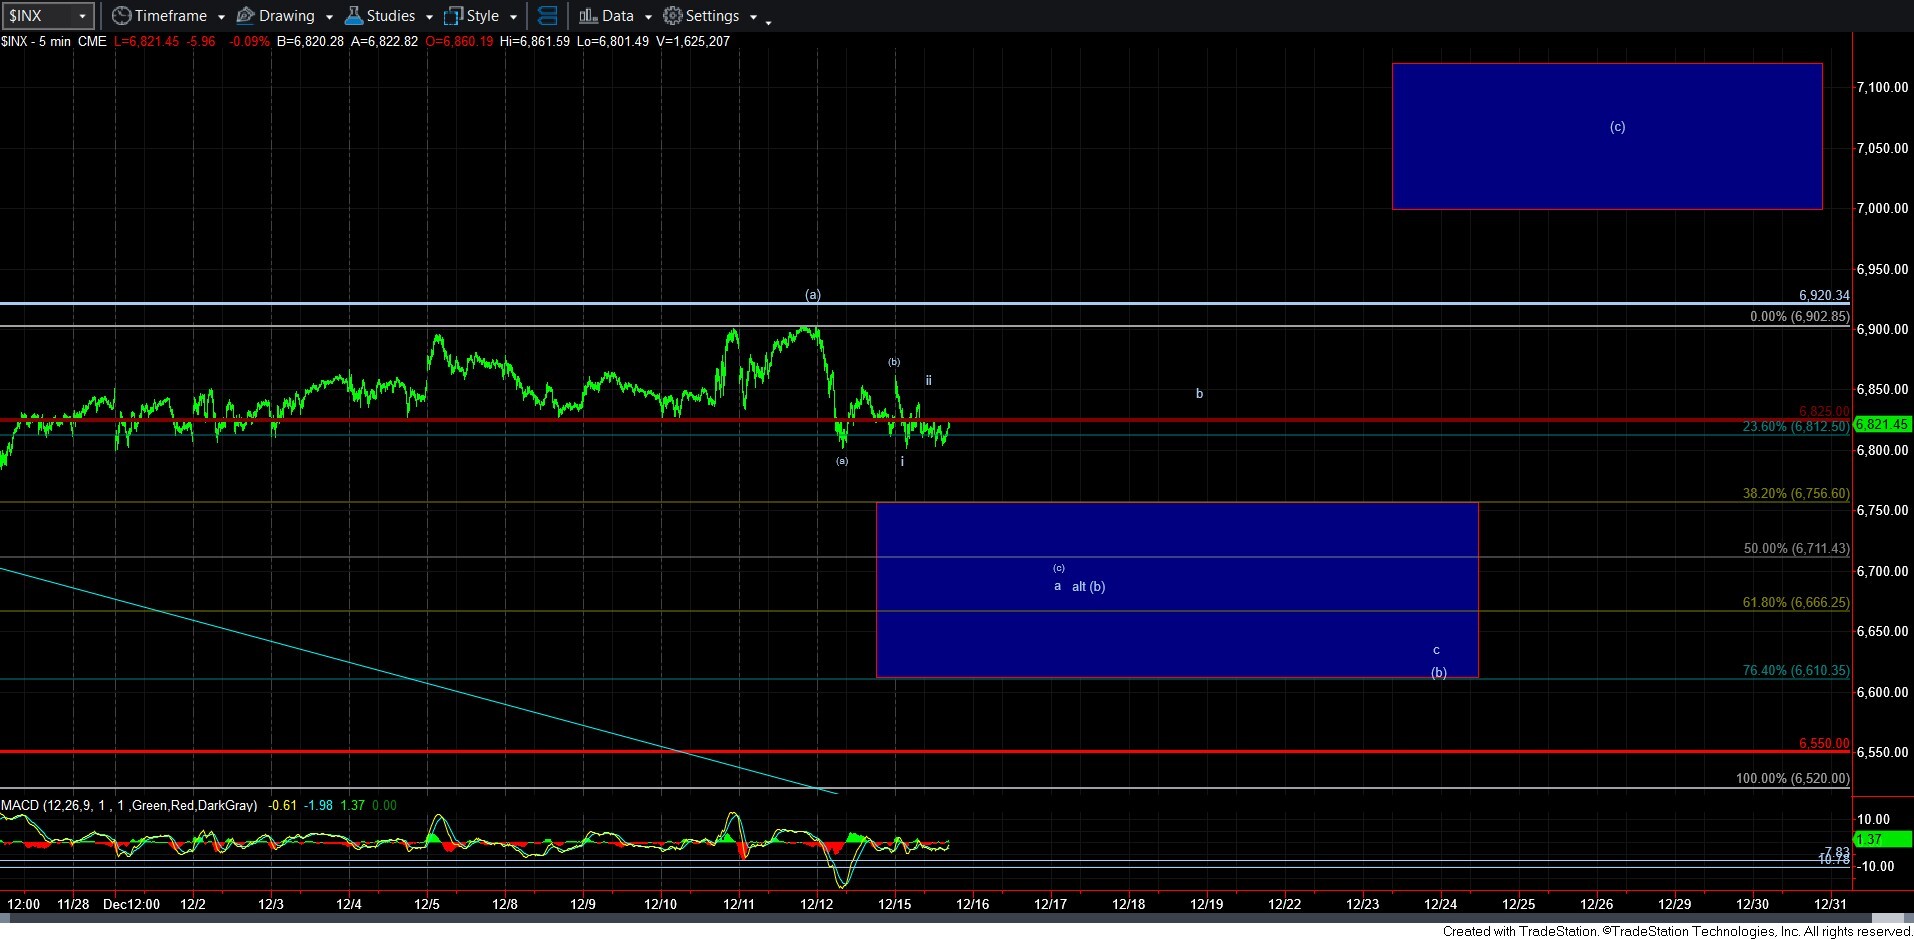
With the market spiking higher this morning into the open, we seem to have completed a (b) wave consolidation structure. You can see this labeled on the attached 5-minute SPX chart. This now suggests that the market is setting up a (c) wave decline to test the support box below.
Assuming waves i-ii are already in place, then this structure is projecting towards the .500 retracement region. Of course, we will need to next see a break down below the 6800 region, which is the low struck on Friday, before we break over today’s high in order to make this our likely path and target.
So, to keep this afternoon’s update rather simple, as long as we remain below today’s high, the market seems to be setting up for a (c) wave decline which is now projecting down just north of the 6700SPX region.
From that point forth, we will be on the lookout to see if the rally off that completed decline is a 5-wave structure or a 3-wave structure. If it is a 5-wave structure, then it would likely signal that the (c) wave higher has begun. If it is a 3-wave structure, then it makes it more likely that the market will have one more decline to complete the (b) wave, likely pointing us down towards the lower end of our support box.
For now, I am not seeing any strong evidence that a major top has yet been struck. And, until that happens, there is clearly a path for one more rally.