Setting Up The Next Rally
While it has become increasingly frustrating to identify exactly how the next rally of wave v of 3 is attempting to set up, I am still very much in the camp that we will be going higher in the coming weeks, even if we have one more trip lower before that begins.
For those that did not see a post on Elliottwavetrader by one of our money manager members (Liberty), he highlighted the latest NAAIM numbers that came out this week:
“NAAIM exposure index is at a 13 month low, and lower than most of last 24 months with exception of plunge in March 2020.”
What this screams to me is “money on the sidelines.” And, it supports my expectations of the potential for the market to go higher in the coming weeks.
The question with which we have been grappling is exactly how the market intends to take us towards 4400SPX in wave v of 3. And, with all the overlapping market action with which we have had to endure over the last few weeks, it still has not made it clear how we get there.
I will start by simply reiterating that I still think the yellow count is a low probability, so I am not going to say much more about it at this point in time. Rather, I am going to discuss the two most probable paths I am seeing at this time.
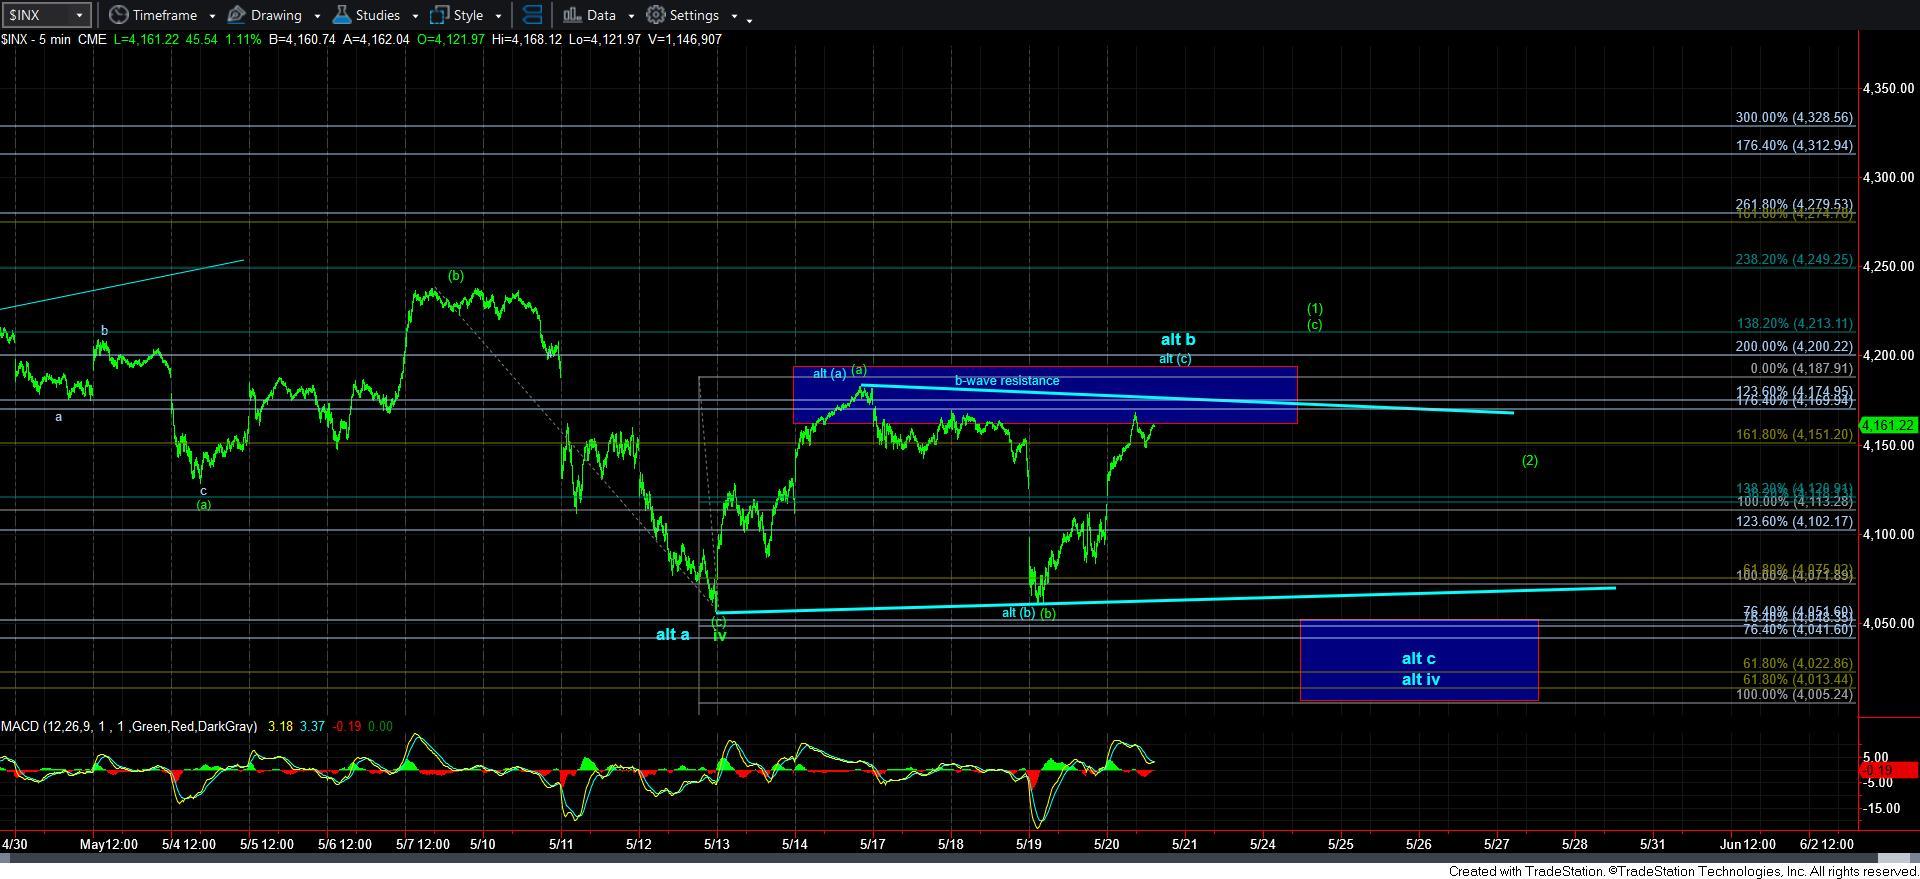
As the market continues to consolidate in this region, I added a more protracted b-wave alternative potential in the SPX this morning, before we begin the rally back up towards resistance. And, the market action over the rest of the morning and early afternoon has now filled this in rather nicely. The resistance in the alternative count is in the 4187/88SPX region, wherein [a]=[c]. As long as the market continues to respect that resistance, then we can either be completing all of a [b] wave in wave iv with this rally, or the market may continue to consolidate in this region within a b-wave triangle before it drops in a c-wave of wave iv. This makes our support 4000-4040SPX, as you can see by the blue support box for the alt iv in blue.
But, this is my alternative perspective, yet it remains higher in probability than I would prefer at this time, at least for as long as we remain below 4188SPX.
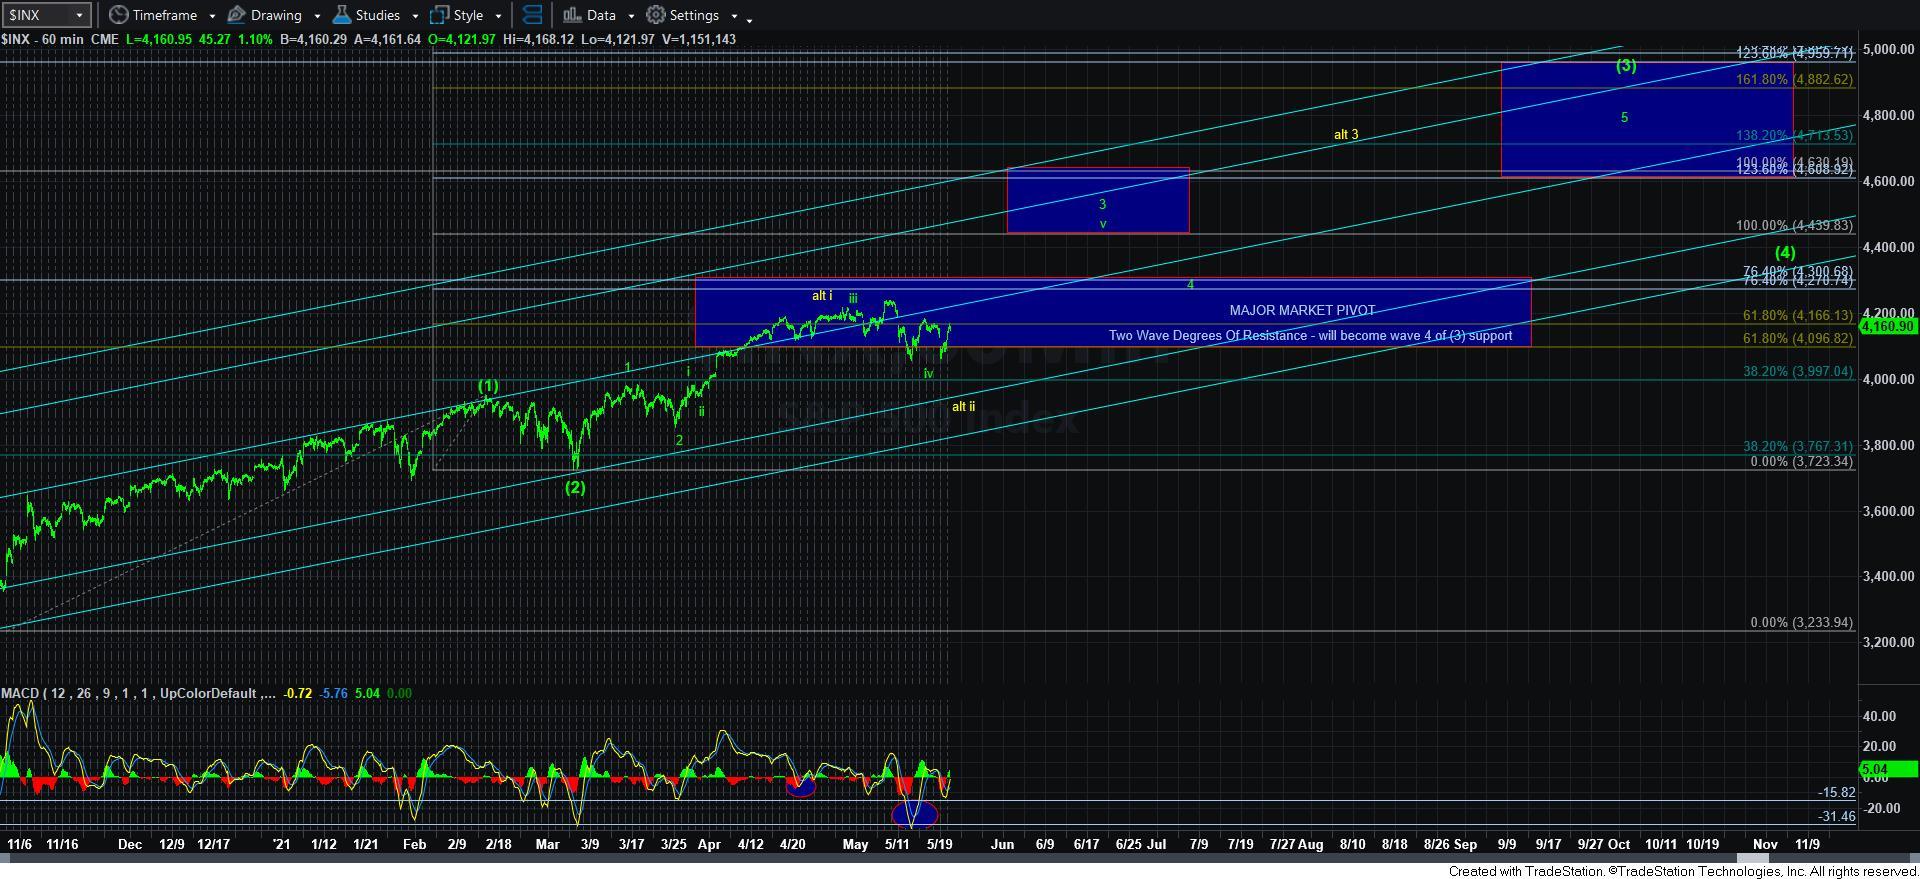
My primary count remains that wave iv completed last week, and the market is going to rally in wave v of 3 as an ending diagonal. So, I want to repost something I posted earlier as an alert:
“I just want to put something out there to think about, because this region has become quite murky.
In this example, I am assuming wave iv is done in the SPX, and we are already in wave v of 3.
Moreover, I am working with the assumption that wave v of 3 is an ending diagonal.
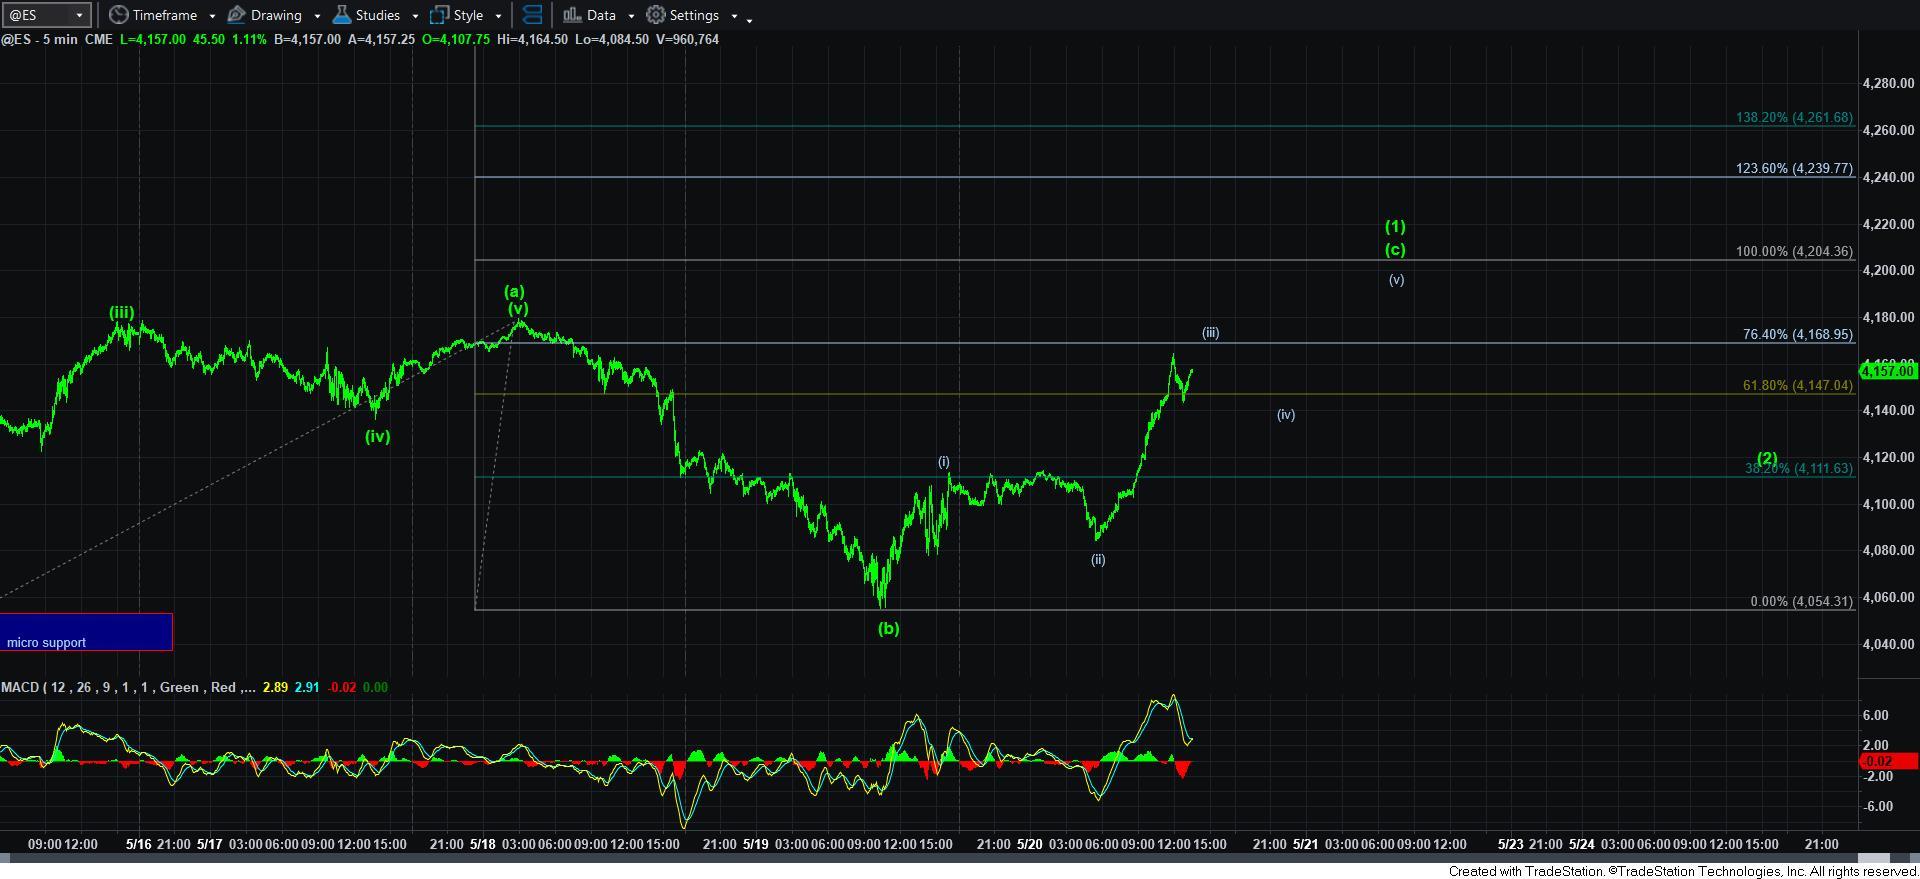
Next, while recognizing that the ES had a lower low than the SPX, I am trying to figure out how to reconcile the two, as there is strong potential to count the rally in the ES (as well as in RTY) as a 5-wave structure, whereas SPX seems to be clearly a 3-wave structure.
Now, here comes a potential way to reconcile the two.
An a-wave can be a 3-wave structure or a 5-wave structure. Therefore, assuming the initial rally was an a-wave off the last week low, it can be an a-wave in ES (5 waves) as well as in SPX (3 waves). And, I would then assume that this could be the a-wave of wave 1 in an ending diagonal, with us now rallying in the c-wave of wave 1 in a big ending diagonal for wave v of 3. But, I will need for us to exceed the 4188SPX region to be more comfortable with this potential. Should that occur, I will have to adopt this as my primary count.
But, I must warn you. If this is indeed what the market has in store for us, we are going to be in for a VERY choppy and difficult next 4-6 weeks until this structure completes in a very internally volatile manner.
I have marked up the initial (1)(2) on the ES chart. But, again, I must warn you that if this is what the market intends, it will be a very difficult trading environment.”
So, in plain English, what does this all mean. Well, it means that we will likely see a lot more choppiness and volatile market action no matter which way the market decides to take us to 4350+.
You see, when the market only provides us with 3-wave structures, it makes it a much more difficult environment to navigate, and does not allow us to use our Fibonacci Pinball structure to its fullest benefit. The reason I say this is because ending diagonals track in 3-wave structures, unlike standard impulsive structures. All waves are counted as a-b-c, which means there is not a lot of multi-day trending moves, which is what is normally seen within a standard impulsive Fibonacci Pinball structure. Therefore, even if we are going higher sooner rather than later, it does make for a challenging trading environment.
As I say quite often, while we will never be able to be perfect in our analysis, as we are dealing with a non-linear environment, I know of no better analysis methodology that can provide you this type of context in the market. And, as it stands right now, it is suggesting a difficult trading environment, especially if we continue higher through the 4188SPX region. So, you may want to take this into consideration if we do break out over 4187/88SPX resistance sooner rather than later.