Setting Up Another Push Higher
Thus far, the ES/SPX has seemingly topped after a 3-wave rally off last week’s low. And, markets do not really top out on a 3-wave rally. Therefore, it tells us one of two things, both of which point to a higher high.
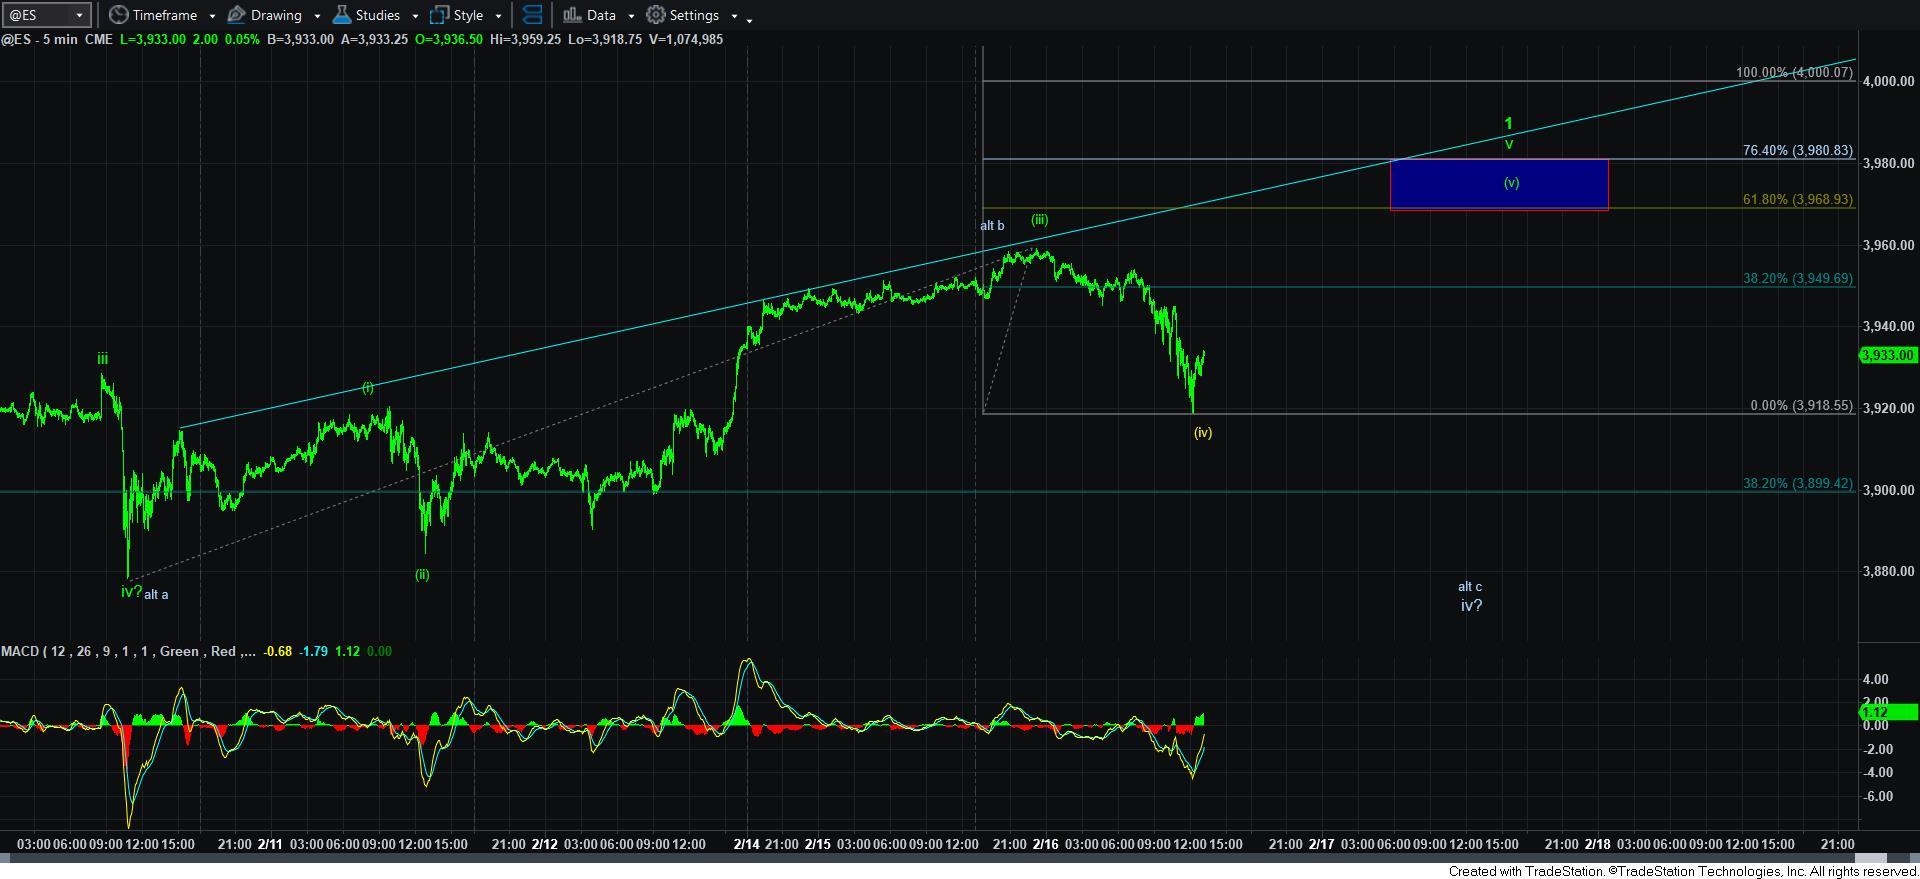
First, I am primarily counting the structure as an ending diagonal concluding wave v of 1, as shown on the 5-minute ES chart. That suggests that as long as today’s low holds, then I am looking for a 5th wave rally to strike the target box on that chart, which would complete wave 1 of [3].
The alternative would suggest the high we struck in the futures is actually a b-wave in an expanded flat for wave iv, which will likely still lead us to a higher high to complete wave v of 1.
However, this resolves, I think the structure strongly suggests that we have another rally to be seen before we complete wave 1 of [3], which should then begin a wave 2 pullback in the coming week or so.
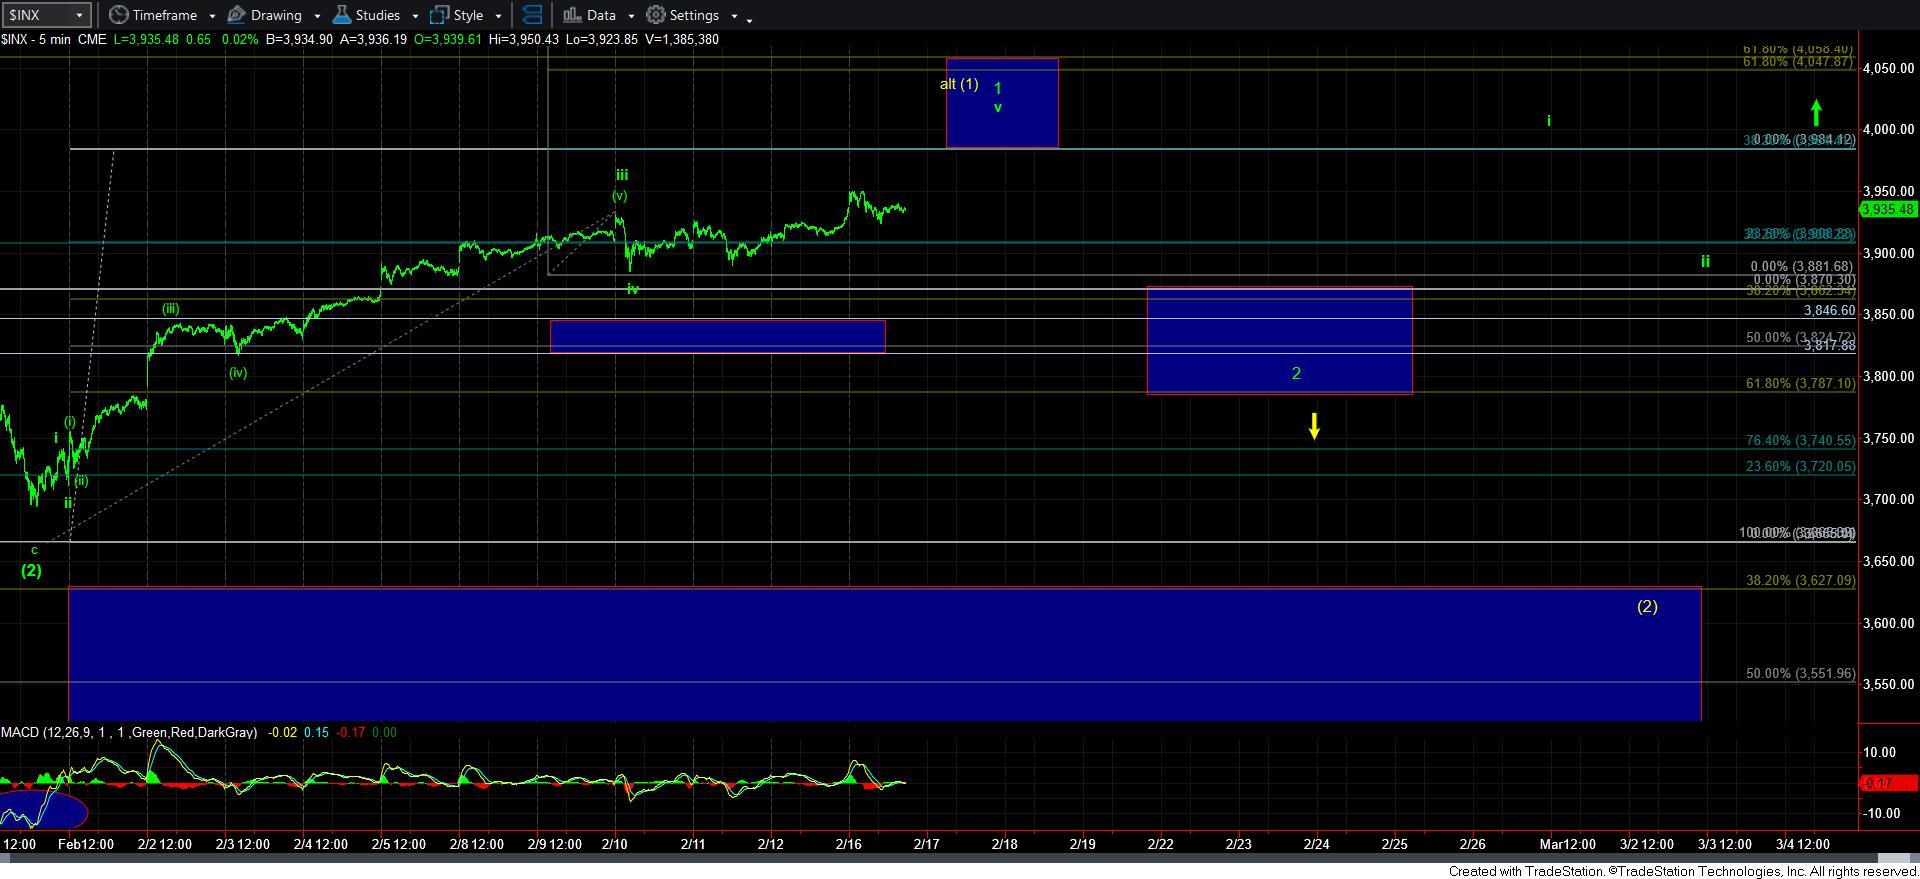
Lastly, please take note of the slightly modified wave 2 support box on the 5-minute SPX chart. I had to modify it slightly lower, as we are projecting to only strike the bottom of the target on the 5-minute SPX chart, which then lowers the level for the .618 retracement of wave 1.
So, in summary, we still need to complete wave 1 of [3], and see a corrective wave 2 of [3] pullback hold our support box on the 5-minute SPX chart. Should that occur and we then see another 5-wave rally structure for wave i of 3 of [3], then we will have to prepare for the eventual melt-up phase of wave 3 of [3]. But, I would imagine we are still several weeks away from that.