Sentiment Speaks: Watch Out For The “Bear Market”
Throughout the years I have been writing on ElliottWaveTrader, Seeking Alpha and other sites, many readers have recognized that we have been quite accurate in our market prognostications, yet they have had a hard time understanding the lens through which I view the markets.
I want to first start by stating that in all the years I have been doing research and analysis into financial markets, I have not found a single form of analysis that provides market context as does Elliott Wave analysis. In fact, it was the reason I was so confident in my expectation that the market would exceed the 4000SPX region even though we were down in the 2200SPX region last year.
So, before I move into my discussion of a “bear market,” I wanted to take a moment to again reference the six-part series I wrote, which explains not only the application of my analysis methodology, but also provides you with the background and theory behind the methodology: https://www.elliottwavetrader.net/market-update/Elliott-Wave-Series-Part-1-201808184848063.html
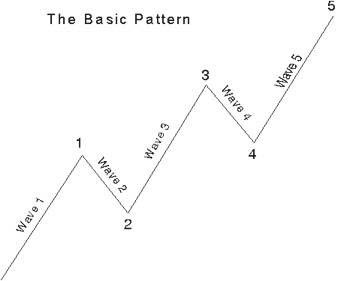
To put it in its simplest form, Ralph Nelson Elliott identified that markets move within a 5-wave structure in the primary trend. So, with this simple context in mind, allow me to explain how I view a “bear market,” and when I expect our next bear market to occur.
But, first, let me give you a little background as to the reason I am writing this article. However, I must warn you at the onset that this article will provide a technical perspective into bear markets. So, if that does not pique your interest, you may choose to stop reading here.
In March of 2020, as we were approaching the lows of that powerful decline, I published several articles wherein I clearly stated my expectations:
"[U]ntil I see evidence to the contrary, I am going to be looking for bottoming signals in the coming weeks, followed by more bullish signals supporting the potential for this market to set up a multi-year rally to 4000+. So, the next few weeks are going to be of utmost importance as to how the next 3 years will take shape for the equity markets."
When I wrote these articles, another contributor on Seeking Alpha, who, at the time we were striking 2200SPX, took quite strong objection to my long-term bullish expectations because I did not share his fallacious belief that the market follows the economy:
“Coming from someone who still thinks the bull market of January is alive enough to carry us to 4,000, that's highly unmeaningful... Here is the 2200 exactly that you said the S&P would bottom at before taking the trip back up to 4,000... What do you want to bet the ECONOMY is going to pull it down a lot further and that 4,000 is a lot further away than your charts ever said... THIS bull market did not ever come close to taking us to 4,000, and it is not taking us anywhere ever again because it is DEAD. OFFICIALLY and in EVERY way. Every index is DEEPLY into a bear market now. The bull is dead, and so it can NEVER take us to 4000. What you predicted can NEVER come true now... my own resolution is that this market has a lot further to fall because it is now following the economy, which it long divorced itself from; whereas Avi doesn't believe the economy ever means anything to stocks and has told me so several times last year... So, you have that common sense view, or you can believe Avi's chart magic will get you through all of that and is right about a big bounce off of 2200 all the way back up to 4,000.”
Recently, he has attempted to clarify that what he said above was not really what he meant. He actually meant to say that my perspective of the market remaining within a “bull market” phase was impossible because we dropped more than 20%. And, that is why he viewed the bull market as being done. For now, let’s ignore the inconsistencies in the last sentences of his post, as I think his words were rather clear, especially when he claims that the market will continue to drop well below 2200SPX because the “economy” was in bear market.
But, I want to address his view of what is considered a “bear market,” as I think this can be a learning opportunity for us all. As I tell my members all the time, one should never simply accept what is regurgitated in the media as “truth.” We must always seek out truth through a thoughtful and intellectually honest process, rather than simply accepting what we are told. This is the intellectual honesty I seek and demand in everything I do. And, I push my members to do the same.
I want to first start with the general definition of a “bear market” I found on Investopedia:
“One definition of a bear market says markets are in bear territory when stocks, on average, fall at least 20% off their high. But 20% is an arbitrary number, just as a 10% decline is an arbitrary benchmark for a correction. Another definition of a bear market is when investors are more risk-averse than risk-seeking. This kind of bear market can last for months or years as investors shun speculation in favor of boring, sure bets. . . . A bear market should not be confused with a correction, which is a short-term trend that has a duration of fewer than two months.”
While I will later discuss the issue of this being an arbitrary benchmark, we need to first recognize that, even within this definition, there is a wide view as to what is considered a bear market. And, even based upon this definition, the decline in March lasted “fewer than two months,” and, therefore, does not meet the general classification of a bear market. Therefore, at first glance, you may view the March decline as a correction within the bull market, based upon the definition presented above.
So, I think this is an appropriate point in time for me to discuss Elliott Wave analysis to provide us with some market context so we can understand the next discussion a bit better.
As I noted earlier, Elliott outlined that bull markets rally in a 5-wave structure. Moreover, that 5-wave structure breaks down into 3 waves that move in the direction of the primary trend, and 2 waves which are counter trend.
Since I viewed the market as only completing three waves off the 2009 lows before the March 2020 decline took hold, I was looking for waves 4 and 5 to complete before the bull market off the 2009 lows completed. Again, this is why I strongly held to my expectations that a rally to 4000+ would be seen from the 2200SPX region lows struck in March 2020.
But, to be honest, I viewed the March decline as only one segment of a larger 4th wave correction. In fact, my analysis suggests that the technical top of the 3rd wave off the 2009 low actually occurred in January of 2018. Yes, I know that the market made a higher high in 2020. However, even corrective structures can still make higher highs.
The best example I can present is the sideways market we experienced from 2000-2009. Even though we made a higher high in 2007, the nature of that entire move between 2000-2009 was still well within a corrective structure. While the 2020 high was considerably higher from a relative perspective as compared to 2007, it was still a clear 3-wave structure off the December 2018 low. Even if you simply look at the rally off the December 2018 low on a daily chart, it clearly looks like 3 waves. And, corrective rallies take shape as 3-wave structures based upon Elliott Wave analysis.
So, while most market participants seem to wrongly view the March 2020 decline in and of itself as “the shortest bear market in history,” I view this proposition to be erroneous on multiple levels, as I just explained. To summarize, the March 2020 decline did not exceed 2 months in time from a pure definitional perspective, and it was only part of a 4th wave correction within a 5-wave bull market structure off the 2009 low.
Therefore, based upon Elliott Wave analysis, the bull market off the 2009 low has not yet completed since we did not yet complete 5 waves off the 2009 low.
Now, I would like to address the arbitrary nature of the 20% benchmark. Who came up with it, and why? I can assure you that I am not the first to question this benchmark, and I doubt I will be the last. In fact, Tom Feeny questioned the same in an article he wrote on Seeking Alpha, entitled "The Absurdity of 20% Bull/Bear Market Definition."
While there are many who question it, there seem to be no appropriate answers. Was it because those who came up with this number could only count to 20 using the digits on their bodies?
But, this is yet another market perspective which is accepted, and commonly regurgitated, without engaging in any real thought as to the “why.” Yet, most seem to agree it is purely arbitrary. So, if it is commonly accepted as being arbitrary, why do most freely accept it in the first place?
Let me give you an example of how ridiculous this can become in practice.
In September of 2018, before the market dropped from October 2018 until December 2018, I commented on another author’s bullish article that I saw strong potential for the market to drop from the 2900SPX region down towards the 2200SPX region, which was my ideal target for this 4th wave “correction” off the 2009 lows. Unfortunately, the author of the article strongly disagreed with me.
We all now know that the market indeed dropped from the 2900 region, but it only reached the 2350SPX region. While the structure at the time told me that 2350SPX was likely all we were going to see to the downside at the time, and we caught the bottom of that drop in real time in our ElliottWaveTrader service, the author I mentioned above held his long positions during the entire drop. He later explained to me that he was right for doing so since the drop was only 19.8% “on a closing basis,” and did not reach the bear market benchmark of 20%. I guess he intimated that he would have been wrong if the market would have dropped another .2%. Yet, he was quite proud for holding his positions simply because the market ONLY dropped 19.8%.
So, do you see how ridiculous this can become in practice?
As I said at the start of this article, Elliott Wave analysis provides us with a better understanding of market context relative to any other methodology I have encountered. Moreover, and most importantly, it is not arbitrary.
Therefore, in my opinion, the 20% benchmark is an arbitrary number because it does not take into account any factors for market context. If one truly understands the market context for a price decline, then one realizes just how arbitrary the 20% benchmark to be.
Therefore, my perspective was that the March 2020 decline was the last leg in a 4th wave “correction.,” with a 5th wave rally yet to be seen. And, the fact that we have now reached the minimum target I had of 4000+ certainly confirms and validates the perspective I confidently presented back in March 2020.
When you understand this perspective, you then recognize that when the market completes the 5-wave structure off the 2020 low (ideal target in the 6000 region), we will then complete a larger 5-wave structure off the 2009 low. And, at that point in time, we will finally enter into a bear market.
