Santa's Sleigh Is Dusted -- Is He Ready To Take Off Or Will We See A Failure To Launch?
 By
By
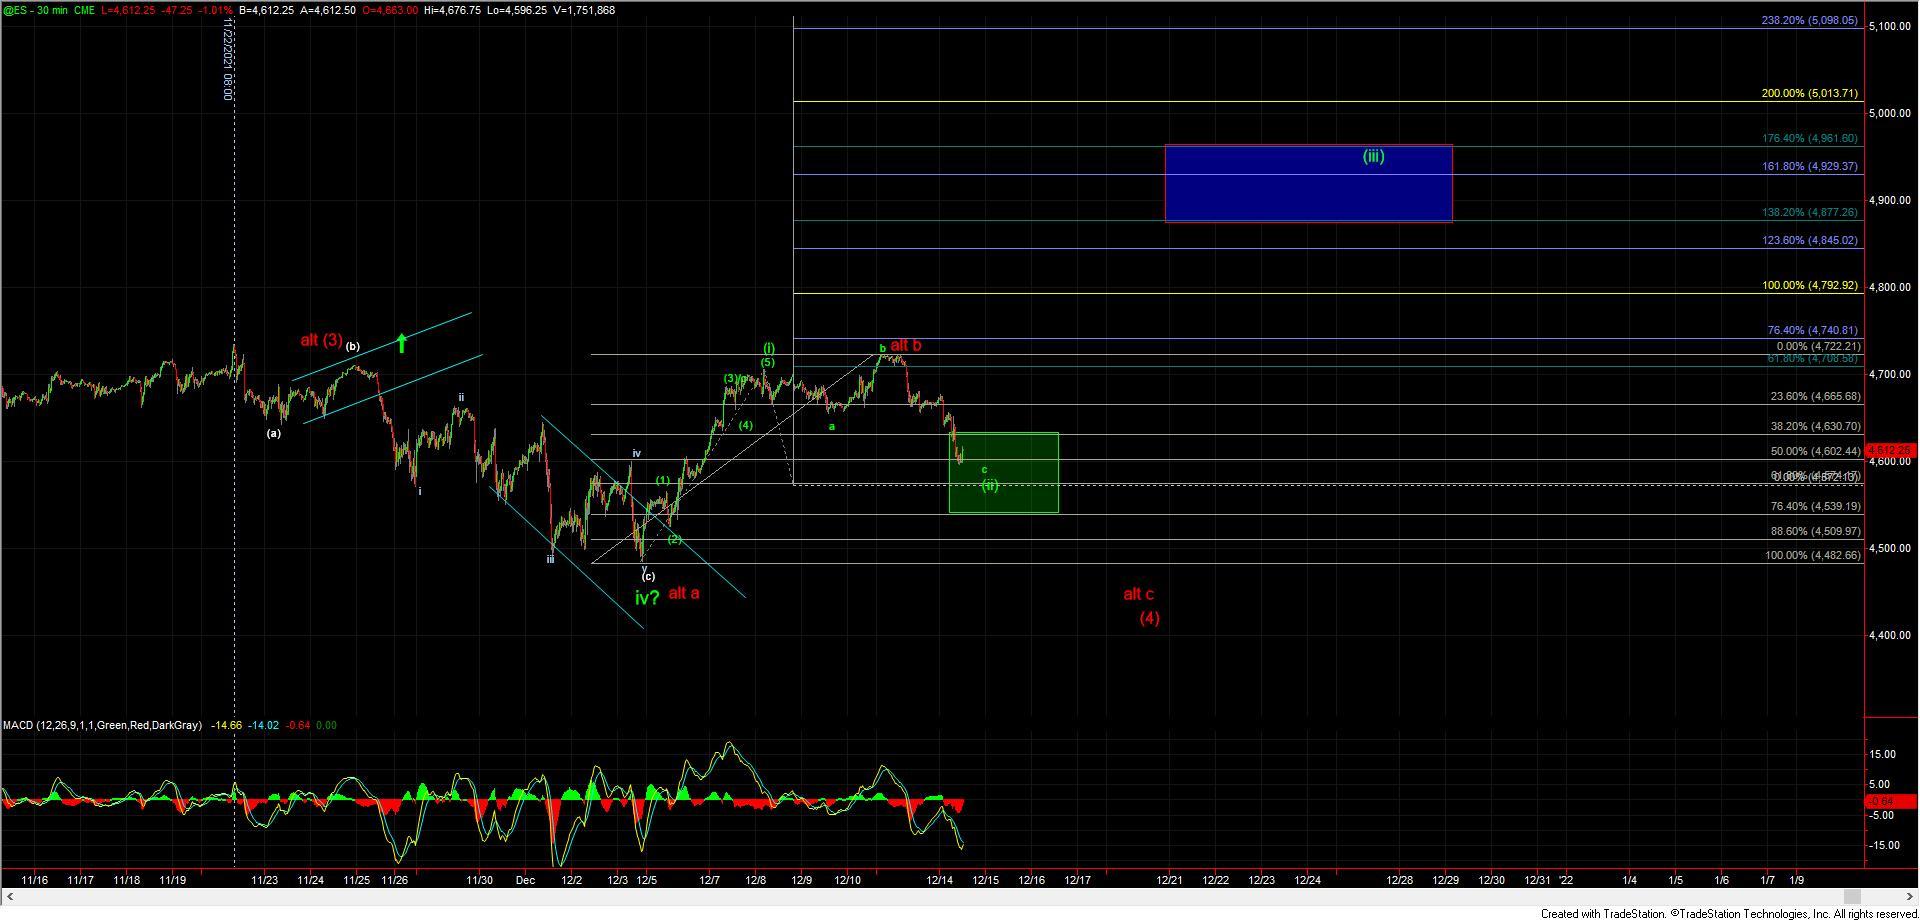
In yesterday's update, I noted that the three-wave high that was struck into the 4722 level on the ES was suggestive that this was not a significant top but rather a corrective move with that high being part of a b wave in expanded form. The move that we saw down yesterday, then, would count as part of a corrective move that began with the high that was struck on 12/8. I also laid out the two possible paths that I was watching for this corrective move to take. Ideally, I would have preferred this to have held the upper end of support for a micro degree wave (4) up off of the 12/5 low and give us one more push higher to finish off the wave (5) of (i).
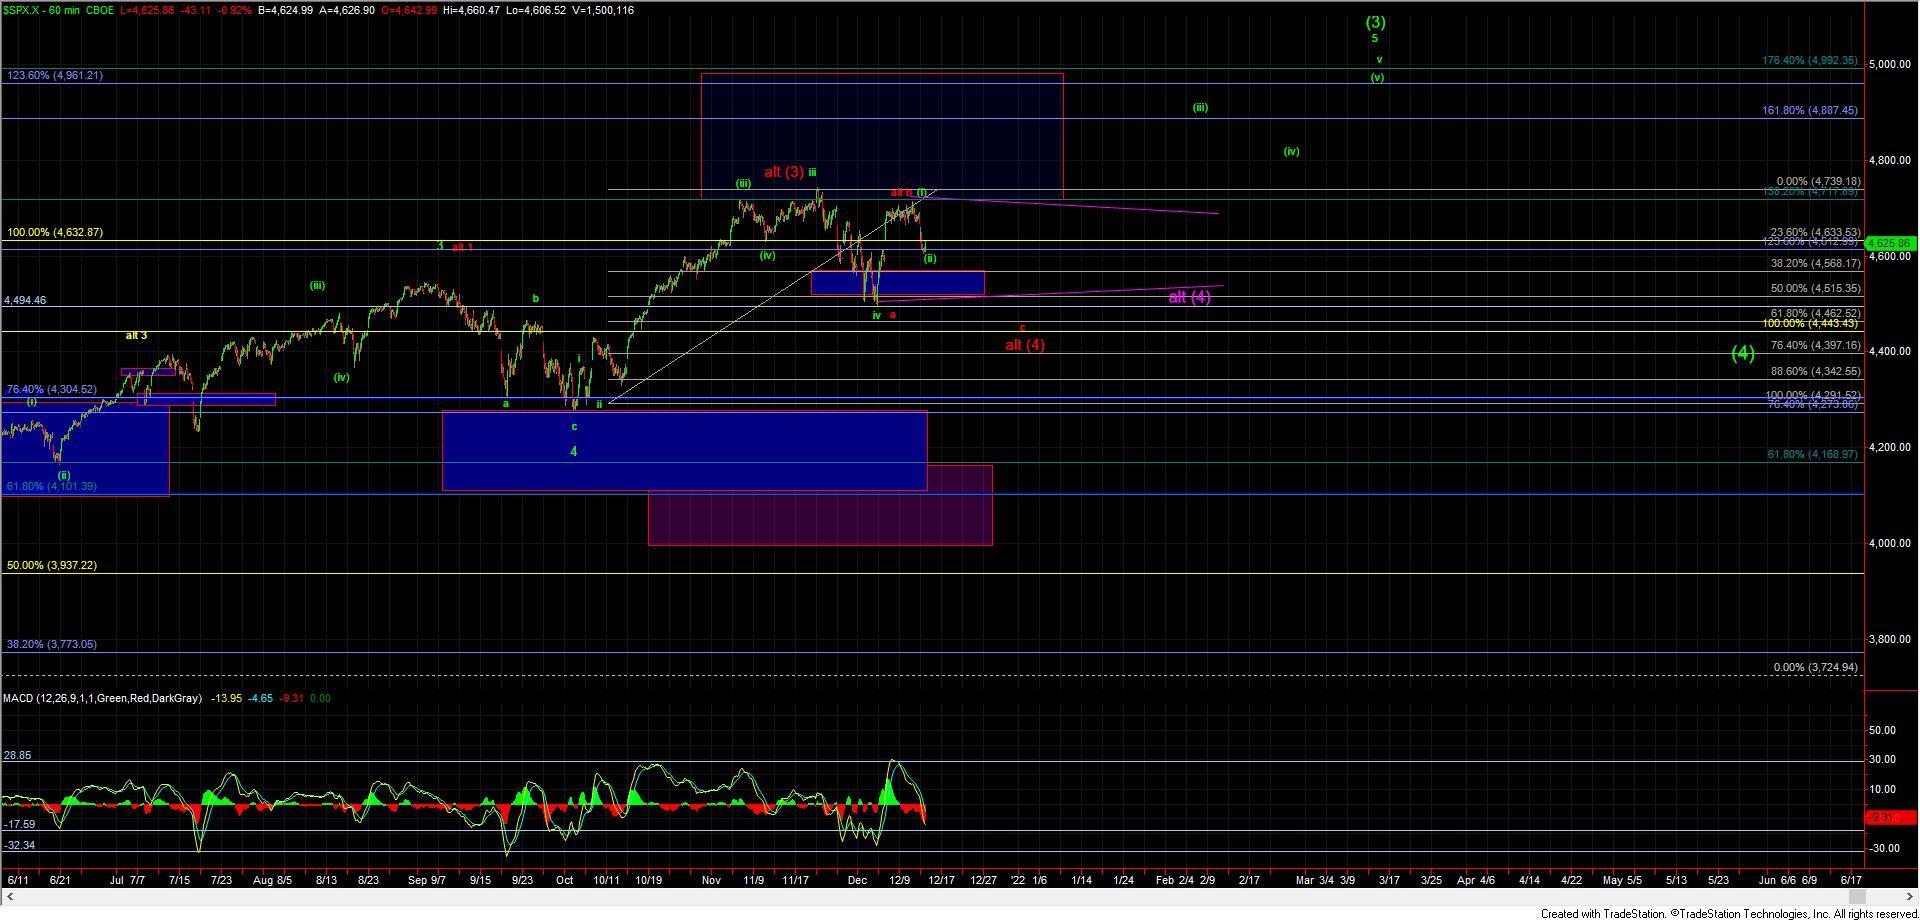
Today, however, we broke that upper support zone and saw a deeper pullback, thus making it more likely that we are indeed following the alternate path on the smaller degree timeframes and are already in the wave (ii) of the larger wave v up off of the lows. Now keep in mind that this alternate path on the smaller timeframe charts as laid out on the ES does not in any way change the primary count that we have been watching on the SPX chart, which is shown in green and is still suggestive that we have struck a bottom in the wave iv and are attempting to push higher in the wave v into the new year. It simply means that the wave (i) of that wave v completed slightly sooner than would have been ideal.
So with that and assuming that we are indeed following the primary green path, once we do see a full five-wave move up off of the lows it will give us the initial signal that we have put in a bottom in the wave (ii) and are beginning the wave (iii) up, which should take us into the end of the year and beyond. Support for this wave (ii) currently comes in at the 4630-4539 zone to which we have already entered. The initial target for this wave (iii) of v will come in near the 4877-4961 zone with the wave (v) of v targeting closer to the 5000-5150 area. These targets will be able to be better defined, however, once we do get that initial five-wave move up off of the lows, at which point we can set our fibs and layout our path per the fib pinball guidelines. I also want to note that the MACD on the 60min chart has reset nicely and is moving into oversold levels in which we had seen many previous lows struck.
If we are unable to hold the 4630-4539 support zone and push below that level, then it would suggest that we may have topped in a wave b of (4) as shown in the red path, still needing a deeper push lower before this finds an ultimate bottom and pushes to new highs once again. With that being said and as I noted yesterday, the structure up off of the lows is not very conducive to this red path. I am, however, going to leave it on the charts for the time being, as this is the most straightforward alternate path that has the potential for this to still see new lows at the moment.
Finally, there is also the potential for this to be tracing out a larger triangle for the wave (4) which Avi did mention this morning. This path is simply a variant of the alternate red count. This potential path has the same issues as the red count in regards to the structure of the move up off of the lows, and the main difference between the triangle count and the red count would be that the triangle count would not see another lower low under the 4482 level but would take longer to complete the wave (4) from a time perspective. Both of these are alternate paths, however, and again for now the green count does remain the primary count as we move into the end of the year.