Santa Dusting Off His Sleigh As Markets Slingshot Higher
 By
By
Over the past couple of weeks, we have seen the SPX sell off a little over 5% have hit the 4492 level last Friday. Of course, the pundits were blaming this selloff on the new COVID variant that was discovered in South Africa which then landed in the U.S. late last week. This "bad" news however seemed to peak just as the market was finding a bottom in what was a very typical corrective bottoming pattern in both the SPX, Nasdaq charts as well as an inverse topping pattern in the VXX in the form of an Ending Diagonal. Furthermore, the technical indicators were also very oversold on all of the major index charts giving us further evidence on Friday that we were approaching at least a local bottom. The Ending Diagonal pattern along with the very oversold technical levels were very good indications that once the bottom was struck the reversal back to the upside was likely to be quite sharp and violent. Today's action certainly did not disappoint in regards to this violent reaction back to the upside and has certainly confirmed that we have indeed struck at least a local bottom with the lows that were struck on Friday. The question we have at hand now is whether this sharp push higher is going to continue to follow through and give us a clean breakout to new highs or whether we are simply watching a major fakeout in the form of a b wave before heading lower once again.
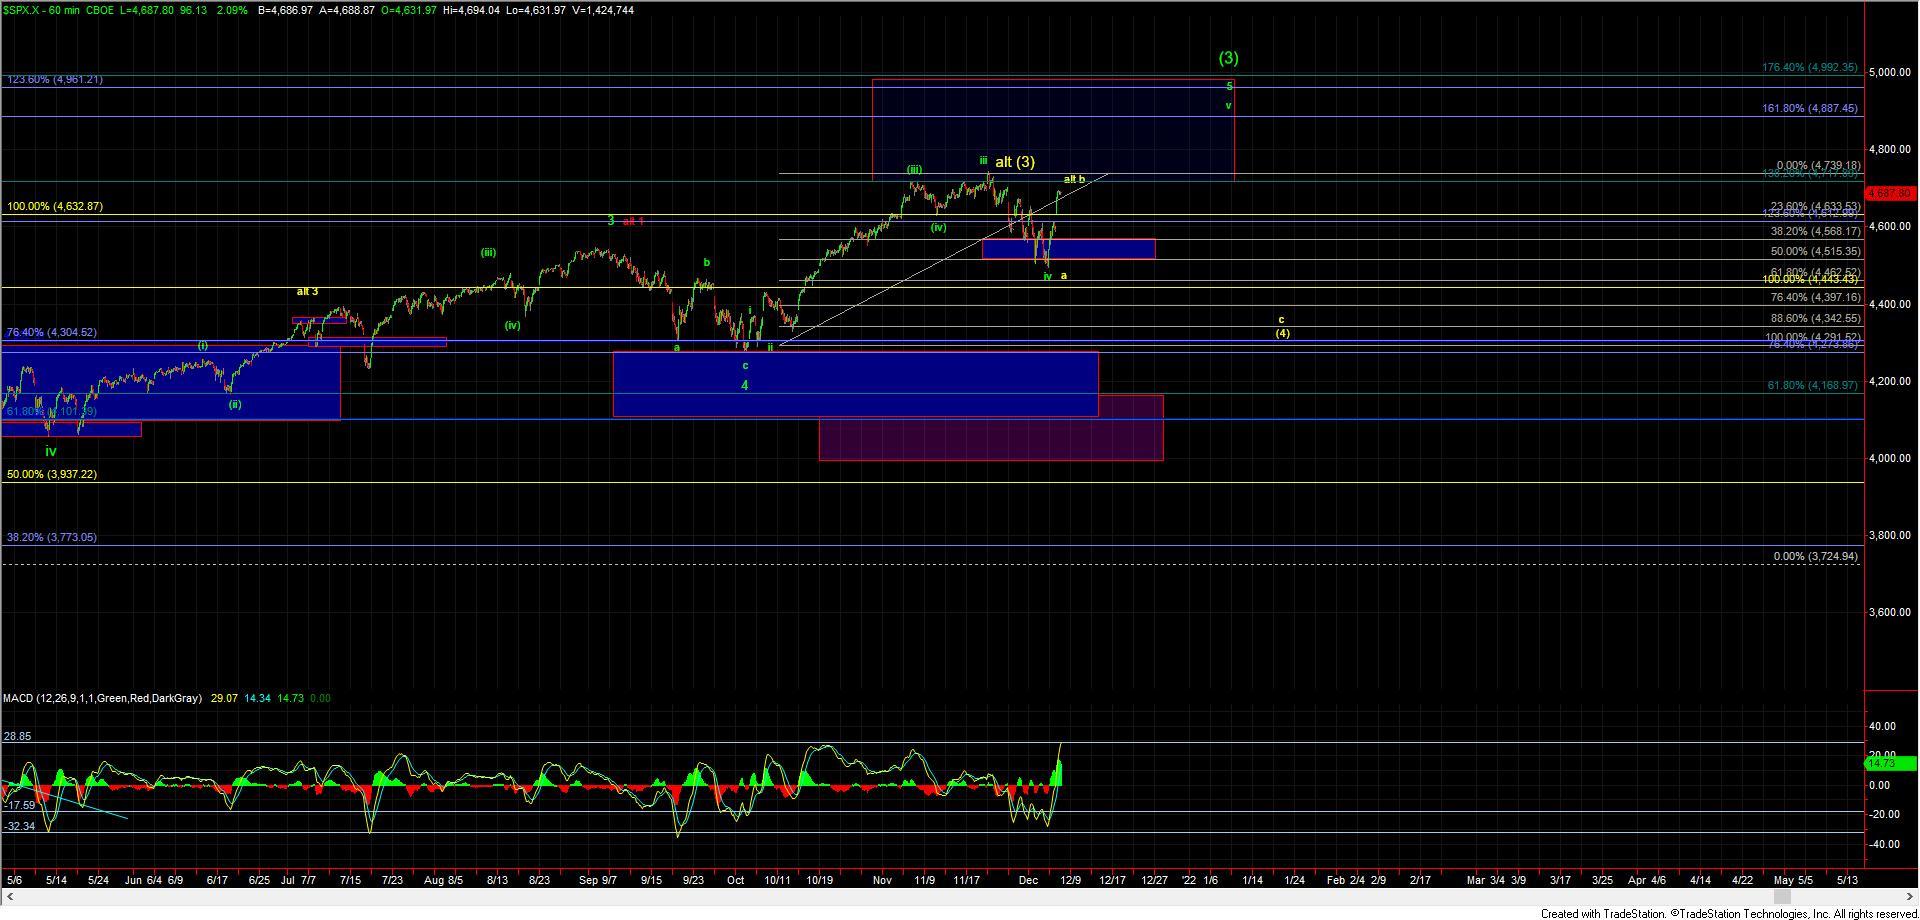
Although this move up is quite sharp and violent I am still counting the move up off of the lows as still only being three full waves so far. So while the third wave of this move is quite extended, from a structural perspective this pattern does still allow for this to be attempting to form a top in a wave b. I am showing this potential b wave top as an alternate on the charts in yellow. I do want to note however that this sharp action up off of the lows is much more typical of a third wave and consistent with the primary green count vs. that of a wave c of a b per the alternate yellow count.
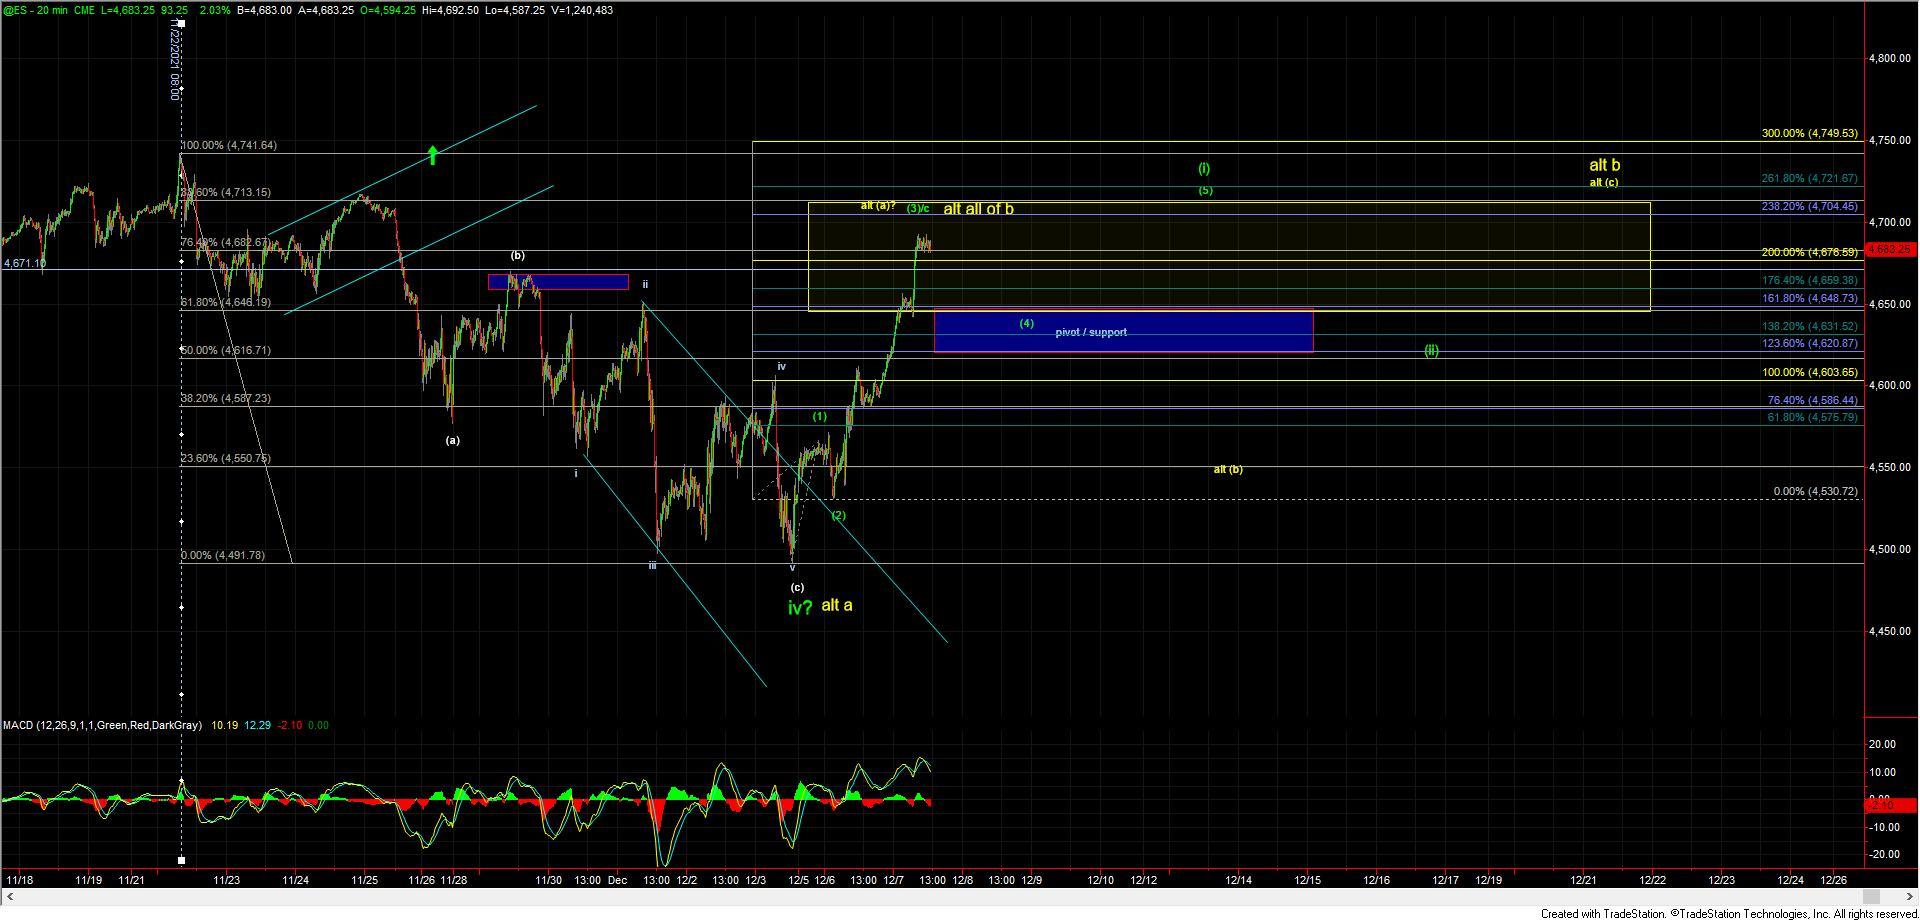
Since I am counting this current move up an extension of the wave (3)/c up off of the lows it puts support for the potential wave (4) in the 4648-4620 zone as shown on the ES charts. So with this being our support zone and the wave (3) being quite extended, I would expect to see a consolidation for the wave (4) occur over the course of the next couple of days. This should then be followed by a wave (5) up if we are indeed following the primary green count. This wave (5) would then mark the top of a wave (i) of one larger degree and give us further confirmation that we have indeed begun the wave v up off of the lows. After topping in the wave (i) we can then watch for a wave (ii) retracement which would potentially give us another shorter-term buying opportunity into the end of the year to finish off the wave v of (3) as shown on the SPX chart.
Alternatively, if this were to see a very clean five-wave move to the downside that breaks below the 4648-4620 support zone as noted above, then the yellow wave b would certainly be something to be on the lookout for. Unless and until that occurs, however, the pressure is going to remain up on the in the equity markets in the near term and the odds are going to be in favor of seeing a Santa Rally into the end of the year.