SPX Stuck In A Holding Pattern
 By
By
Today the Market opened relatively flat and then proceeded to push a bit lower under yesterday's low. That break of the low failed to see a strong follow-through to the downside and we traded in a fairly tight range most of the day. At the time of this writing we are still trading relatively flat on the day and there is really very little to new to report from yesterday's update.
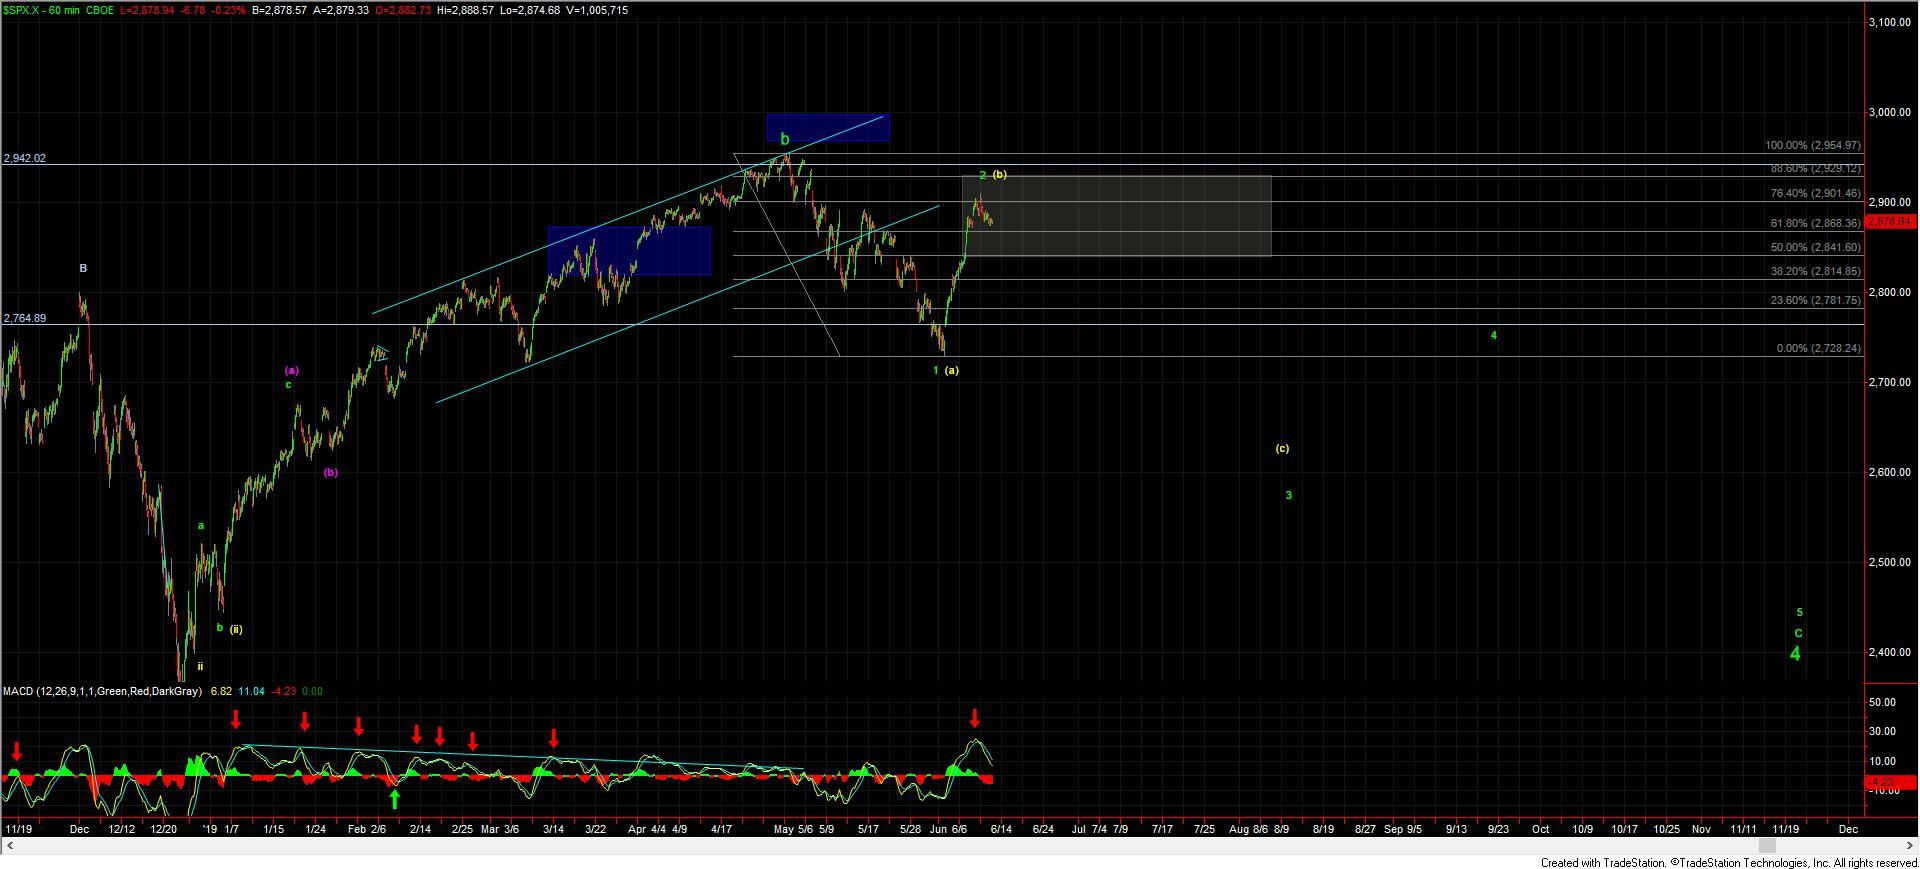
As I noted yesterday the pattern into yesterday's highs can be considered a full abc corrective pattern up off of 2728 low down to the most micro of timeframes. That high was also struck on negative divergence on multiple timeframes and the MACD on the 60-minute chart remains fully rolled over and still pointing down.
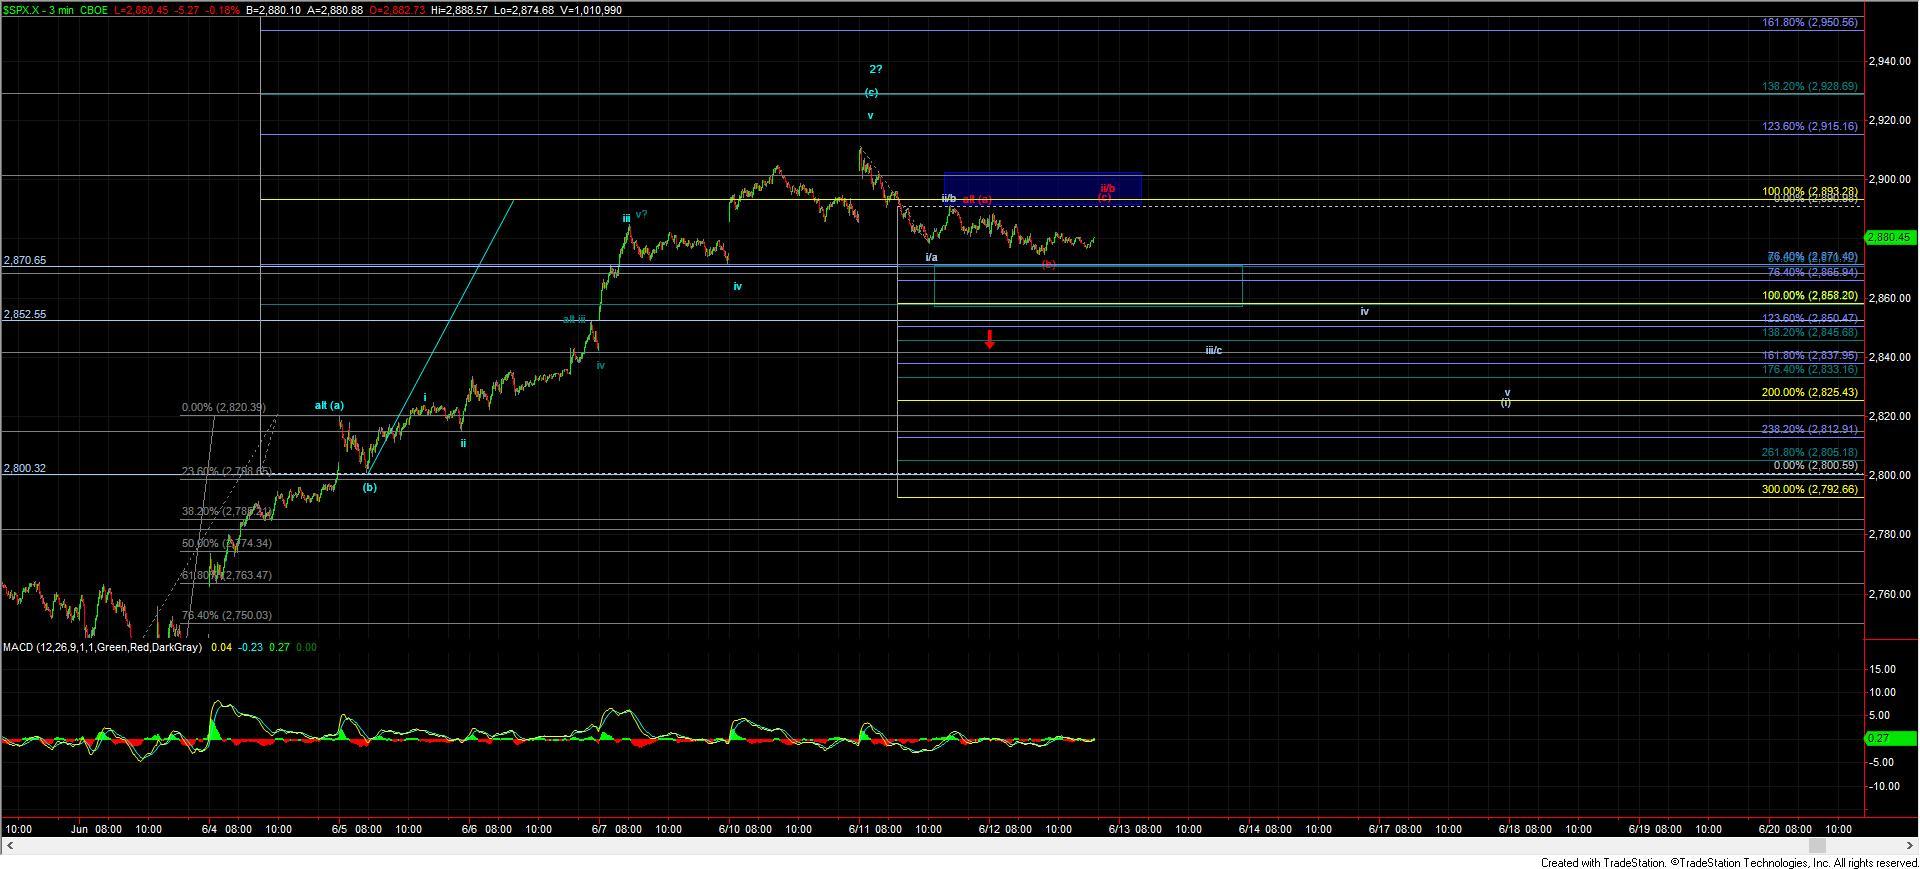
All of these factors are still suggestive that this move is a corrective retrace higher as we have been tracking on our charts. Yesterday's failure right at the key retrace level is also certainly a good signal that we may have struck a top however we still need further confirmation of this with a break of the upper support. At this point in time that price support remains at the 2871-2857 zone on the SPX. Ideally it would be helpful if the market presented a five-wave move to the downside to help give us additional evidence of a top, however, because we are likely dealing with a larger diagonal the next move down does not have to start with a five wave structure. So for that with that I will leave us where I left us yesterday, in that, we need to continue to watch both price and structure as we navigate our way through the market over the next several months.