SPX Pushes Higher as We Look Towards Another Buying Opportunity
 By
By
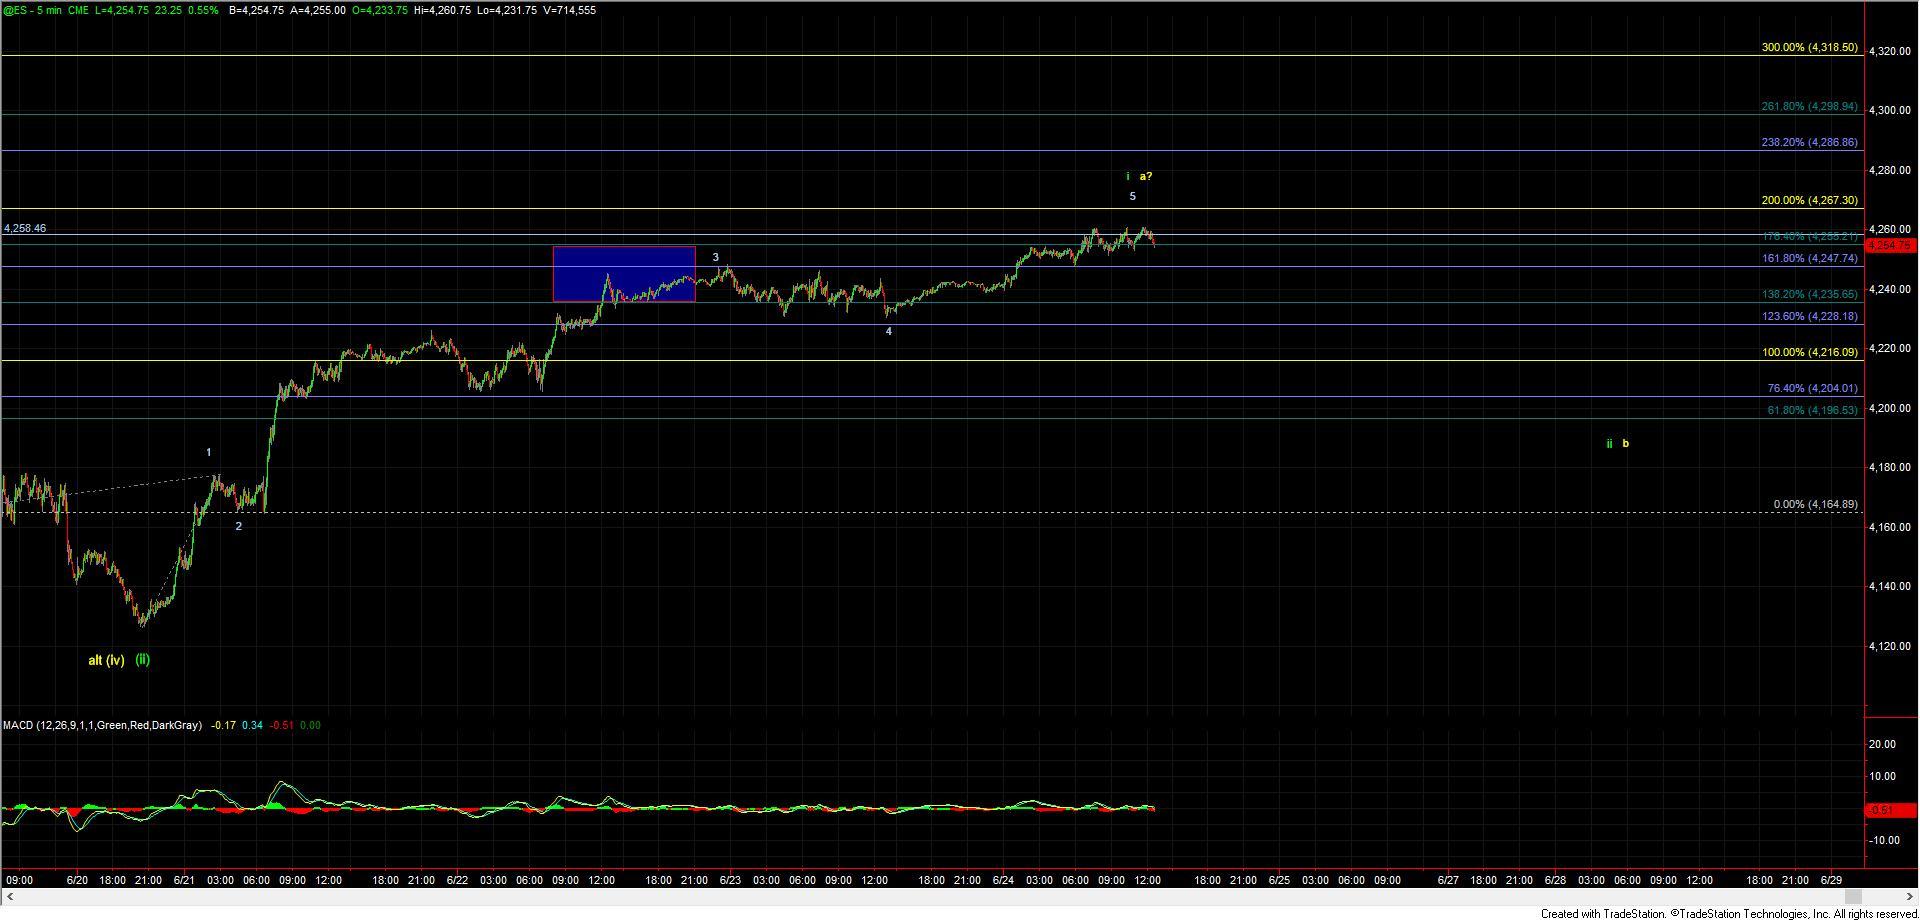
Today both the ES and SPX pushed higher after consolidating yesterday which has presented us with a clean five-wave move up off of the lows on both charts. Having this five-wave structure is very much supportive of seeing further upside action in the coming weeks ahead.
So, with that, the next pullback that we see should provide us with another buying opportunity on the SPX. Furthermore, with the five up off of the lows, we are now able to re-order the counts and make the primary path pointing us up towards the 4440-4500 zone for wave v of 3, which has been changed to green from the previous yellow count. The previous green count is now the alternate count and back to yellow again.
Now while we are able to change the order of the primary vs. alternate counts with what is five up off of the lows I still cannot fully eliminate the yellow count. This is due to the fact that this five-wave move off of the lows can still count as wave a of (v) under the yellow counts ending diagonal. With that being said the point at which this potential ending diagonal path would now project to would likely exceed our major market pivot level which is shifting the odds to the more immediately bullish count now labeled in green.
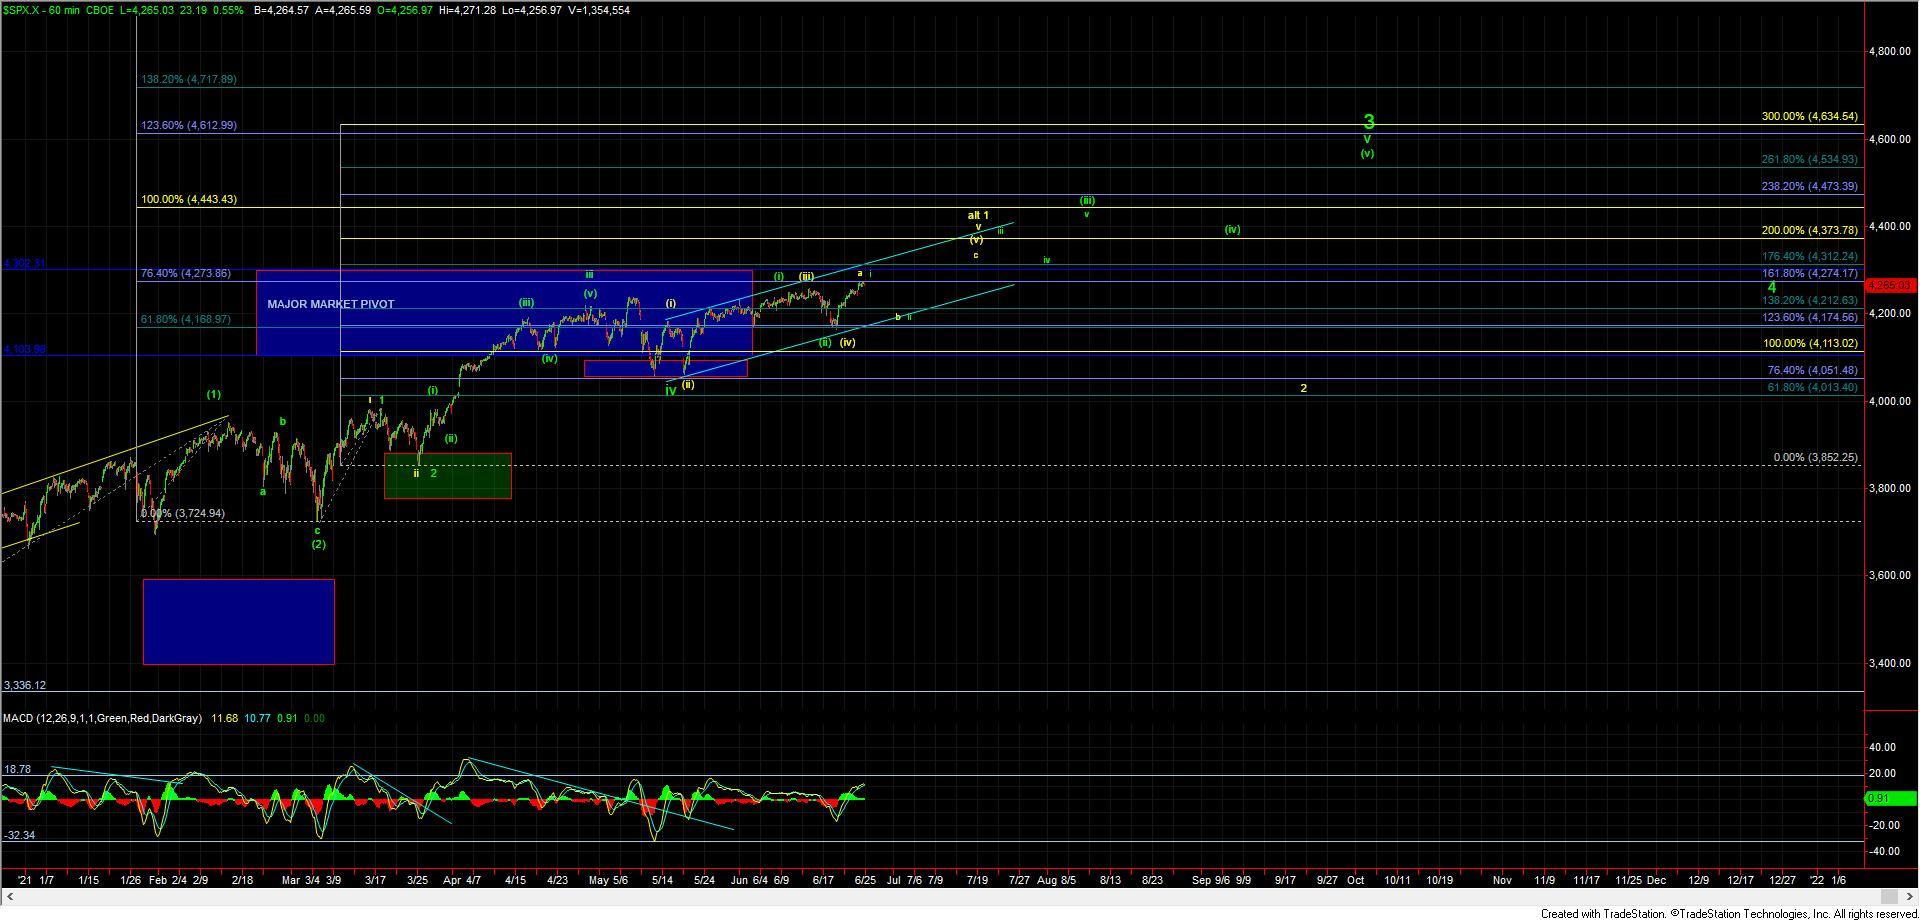
Of course, in either case after getting this five-wave move up off of the lows a corrective retrace will provide us with a clear and well-defined buying opportunity. From there we can then simply use our Fibonacci pinball guidelines to provide further guidance should the market indeed follow through to the upside. We will be able to layout those price pivot levels along with support levels once we see where we actually pull back to and then push to new highs. I will note that I am likely going to be viewing the 4320-4370 zone as a fairly key pivot zone that should help signal a breakout per the green count. Moving through that zone then would likely keep us on track to move into the 4500-4600 region for the wave 3 as shown in green on the 60min SPX chart.
Finally, I wanted to note that when the markets are near pivots of multiple degrees we can often find the market in between multiple counts. This can make identifying and tracking the various wave degrees difficult. Avi posted the note below in an intraday update and I am including it here in the nightly update to help give further clarity to the counts and how they fall within the various waves and degrees:
One of the hardest parts of Elliott Wave analysis is trying to keep track of the various wave degrees that we are counting on the various charts. Right now is no exception. So, let’s try to drill down to understand where we are.
Let’s begin by assuming that we are in wave v of 3 as presented on the 60-minute chart in green (Shown near the 4600 area). As you can see, we seem to be projecting to 4500+ for this wave 3, assuming we continue to maintain this structure using our Fibonacci Pinball parameters. We will continue to track these to make sure we stay on track for this target, and if we see an early warning sign [by breaking below key fib pinball support levels], we will know early enough to protect ourselves.
Assuming [that] we are in wave v of 3, we need to now track how waves (i)-(ii) within v of 3 take shape. Based upon the count I am now tracking, I am viewing last week’s pullback as wave (ii) of V of 3. If you look on the 60-minute chart, you will see that clearly labeled. Moreover, if you look at the ES chart, you will see it in the lower-left corner of the ES 5min chart.
So, from here on, we are going to be tracking the wave (iii) of wave v wave degree to make sure we stay on track for the 4500+ region.
Since wave (iii) of v is going to take shape as a 5-wave structure as well, I have counted wave i of (iii) as topping out in this current rally we are seeing off last week’s low, which means we can reasonably expect a wave ii pullback in the coming days. Once wave ii of (iii) takes shape, and we then break back over the high of wave i, we will have a strong indication that we are in wave iii of (iii) of v of 3 [which is all labeled on the 60-min SPX chart].
Should we get that breakout, we will move our supports up based upon our Fibonacci Pinball structure developed with wave i-ii of wave (iii). (We cannot do it yet since we need to have the wave ii of (iii) in place to project the Fibonacci Pinball support and structure for waves iii, iv, and v within wave (iii) of v of 3.
I hope this provides a bit more clarity on the micro structure within wave v of 3, as I know this is complex, especially when trying to keep all the various fractal degrees straight in your mind.