SPX Is Such A Mess
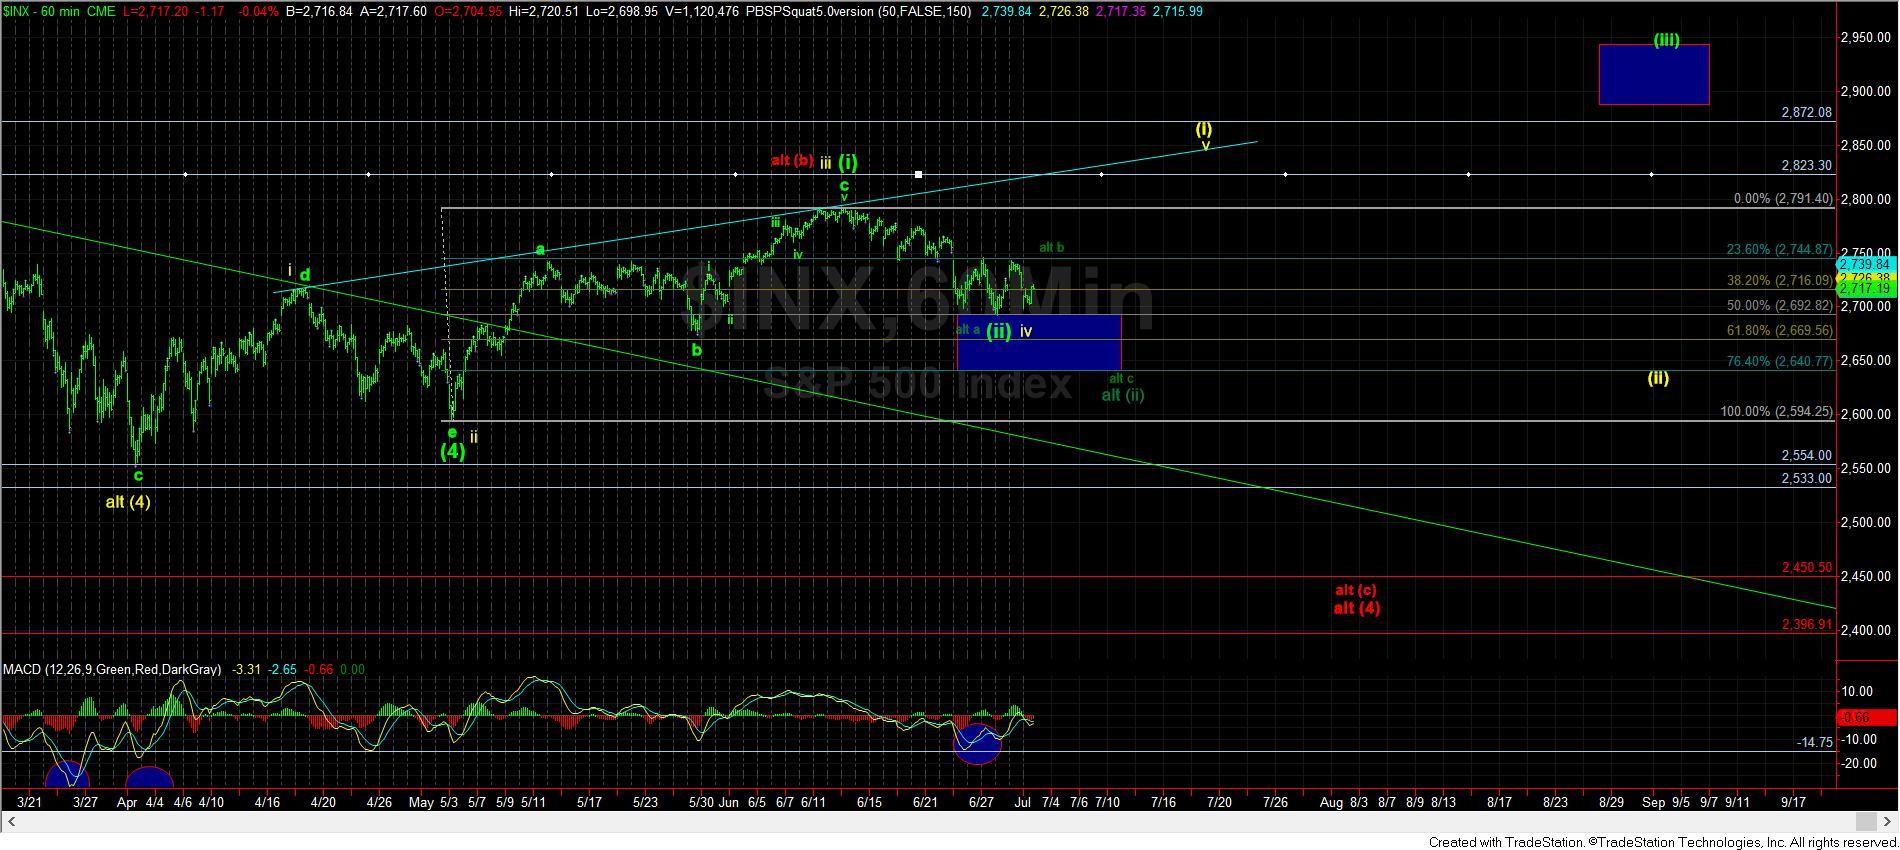
As I tried to explain over the weekend, while there is still potential that SPX is in a standard impulsive structure for its wave (5) (yellow count), it is just as likely that this wave (5) takes the shape of an ending diagonal.
But, as I also explained, due to the overlapping structures in the SPX, there are so many potential counts I am tracking, that I cannot suggest one has a significantly higher probability over another, just based upon the SPX chart.
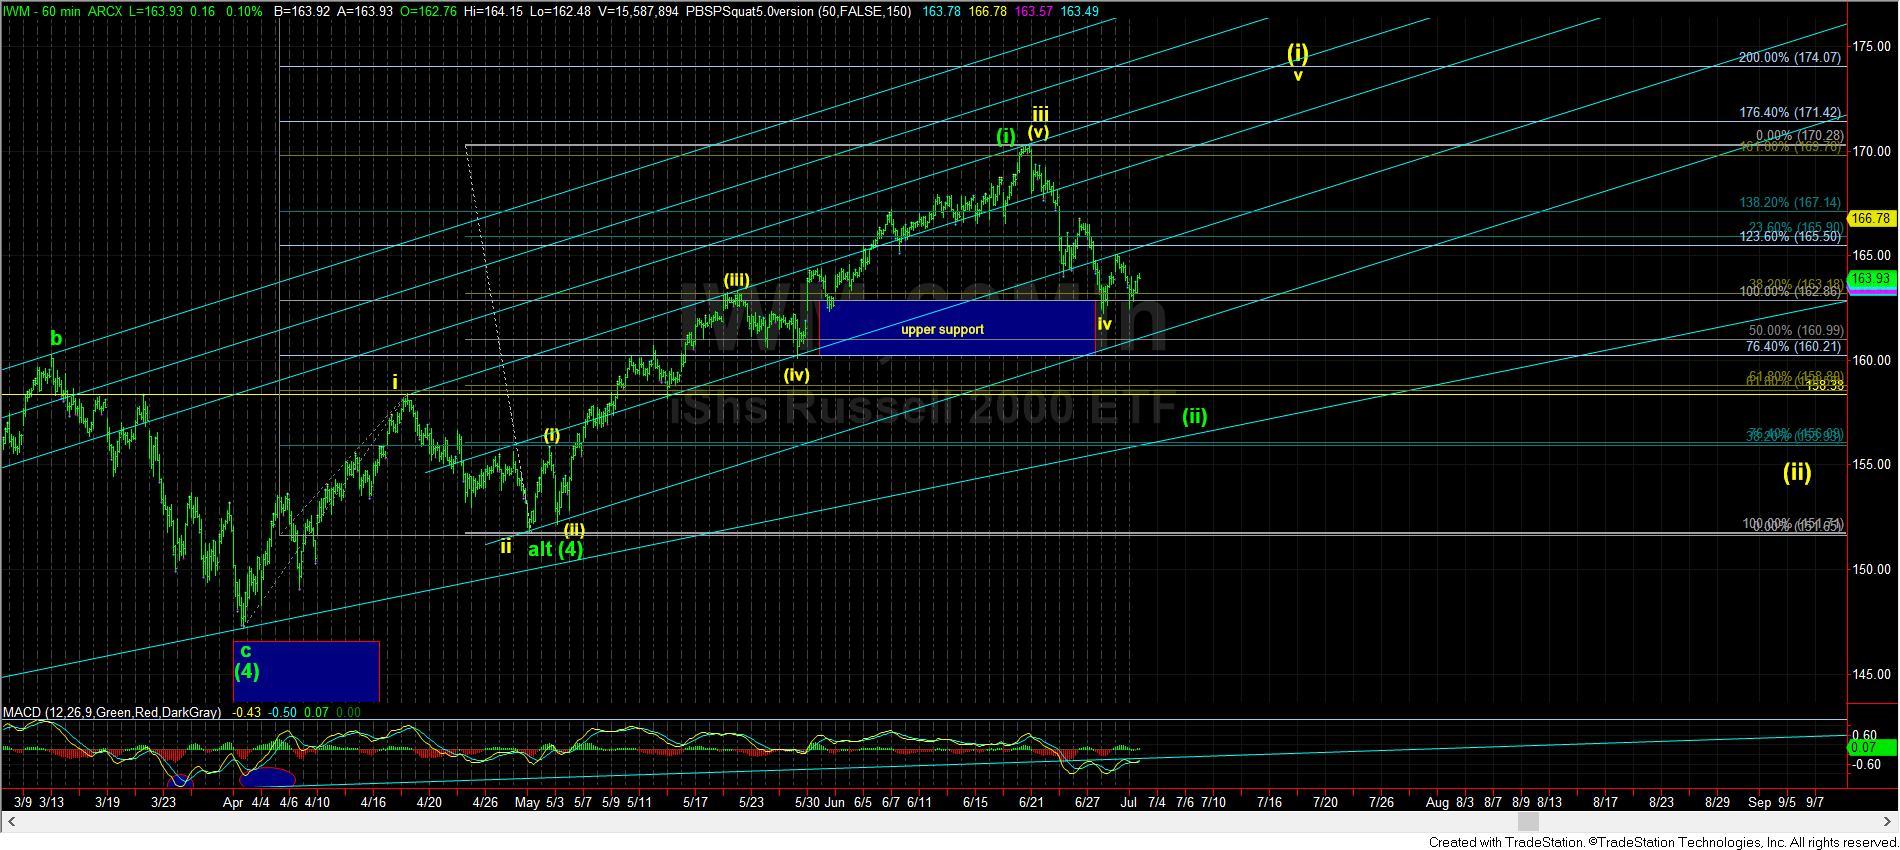
Yet, when we move over to the IWM chart, it does have two higher probability patterns, both of which are still quite bullish. Assuming we are able to hold the lows we struck last week, we should be able to rally up towards the 174 region to complete wave (i) in yellow. As I outlined over the weekend, that region will likely tell us if the yellow count will continue to play out, or the more direct green count is playing out, wherein we have already struck the lows for wave (ii) in green.
Remember, the yellow count still can take us down in a big way for a wave (ii) retracement into the end of the summer before the 3rd wave of wave (5) truly takes hold. Alternatively, a strong break out through the 176 region suggests we are going to complete wave (5) sooner, and in a more direct fashion towards the 195-200 region in the IWM.
Alternatively, based upon the IWM chart, if we were to see a sustained break of 162, with follow through below 161, then it would place me squarely in the green count, suggesting that wave (ii) is retracing a lot sooner than later this summer. So, we still have to be somewhat patient regarding the market signals of how we proceed to the highs of wave (5), with that deeper wave (ii) projecting to a top of wave (5) in standard extensions to 190-195.
Additionally, as you can see from the SPX chart, the market can even rally up towards the 2750SPX region, where we would have an (a)=(c) pattern into that level, and provide us with a b-wave top in a more protracted wave (ii) – presented in dark green – which then points us down to the 2640SPX region in wave (ii) of the ending diagonal we are tracking as a potential for wave (5). So, this means that if the yellow count is going to have a chance to play out to point us up towards the 3225SPX higher target region, we will need to exceed the 2750SPX region sooner rather than later.
So, is still may take us several more weeks before the market decides the path it takes to complete this rally for wave (5).