SPX Closing In On The Next Key Pivot As It Breaks Out To New Highs
 By
By
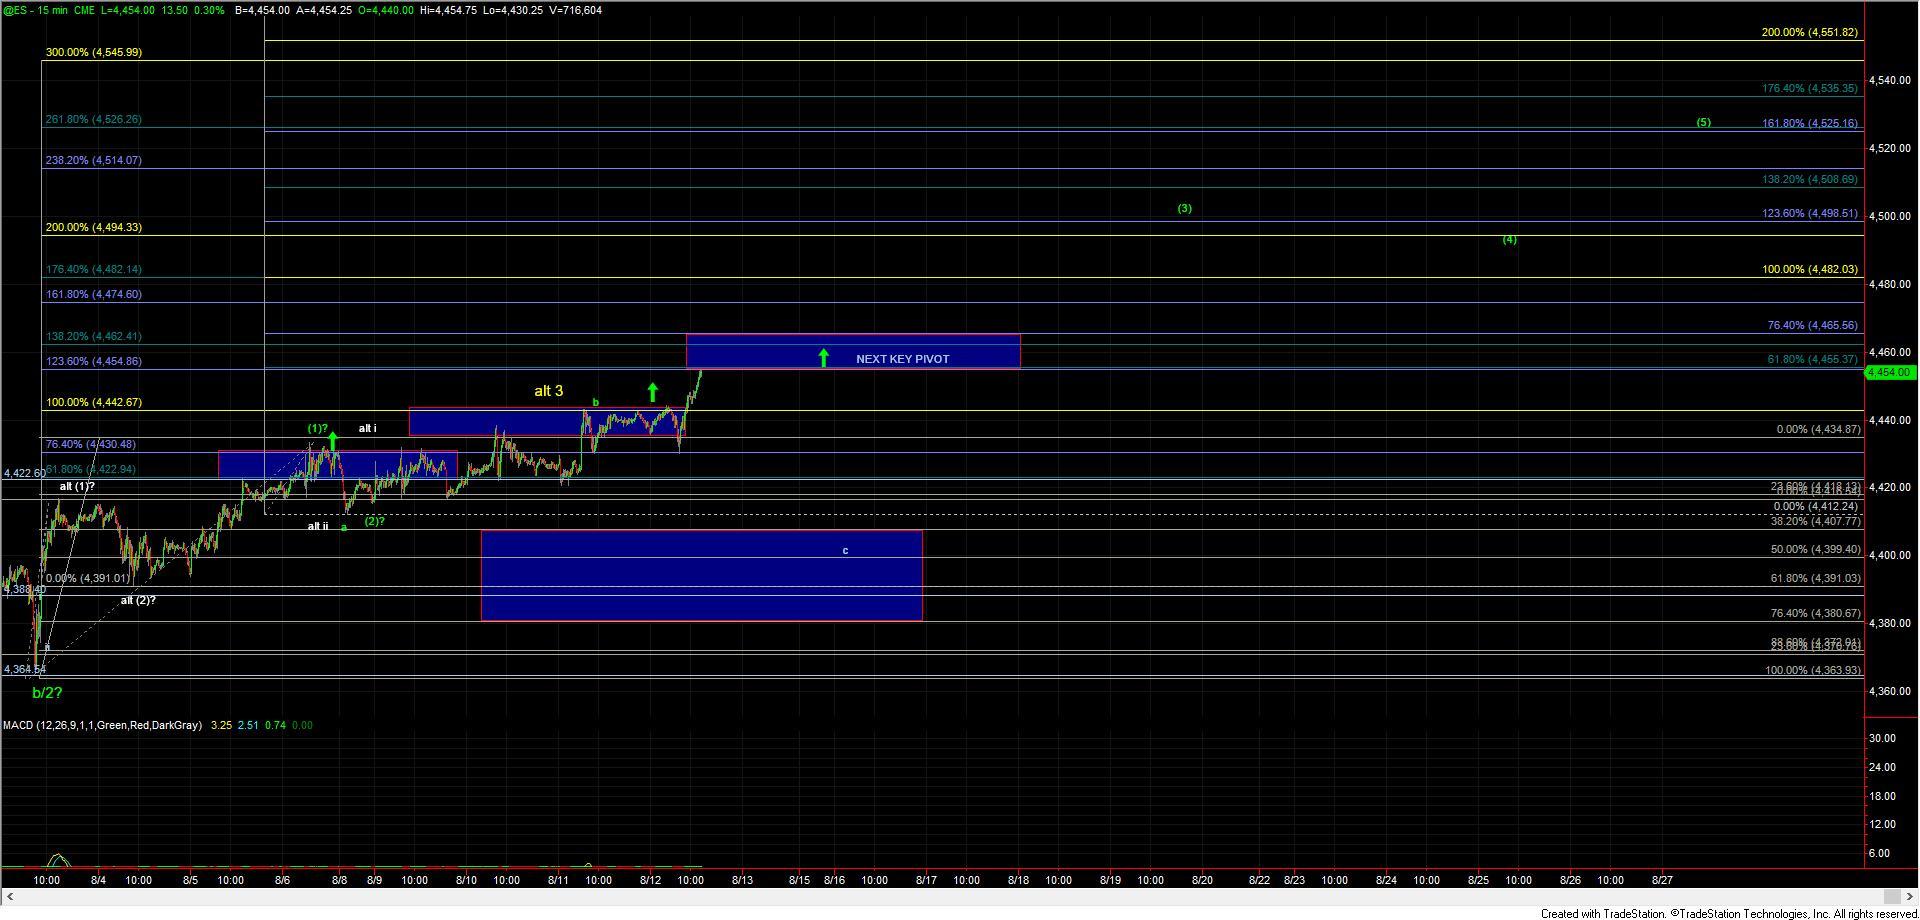
After testing the 4442 resistance level several times over the past few days the ES finally broke sharply through that level today giving us the initial indication that we have indeed bottomed in the wave (2) as shown per the green count on the charts. Now with that being said and as I have noted previously the action up into the highs is still not what I would consider a terribly clean pattern on the smaller timeframes so we need to continue to rely on our fibs and fib pinball framework to help give us further guidance as this pushes higher.
Now because I am viewing it possible to count the top of the wave (1) at either the 8/3 high or 8/6 high there I can consider the key upside pivots in two different places on the charts. Fortunately, however, both of these pivot and resistance levels do align in a manner that we can use either to help further confirm that a breakout towards the 4500-4550 region is underway. That first pivot has already been cleared as noted with the break of the 4442 level which represents the 100ext of the initial move up off of the 8/3 low and into the 8/3 high. The next key pivot comes in at the 4455 level which is both the 123.6 ext from that same move into the 8/3 high as well as the 61.8 ext from the move up into the 8/6 high. If we can then break through that 4455 level the final pivot level that I would want to see broken to give us final confirmation that we have indeed bottomed in all of the wave (2) would come in at the 4485 level which represents the 138.2 ext and the 76.4 ext of those respective moves.
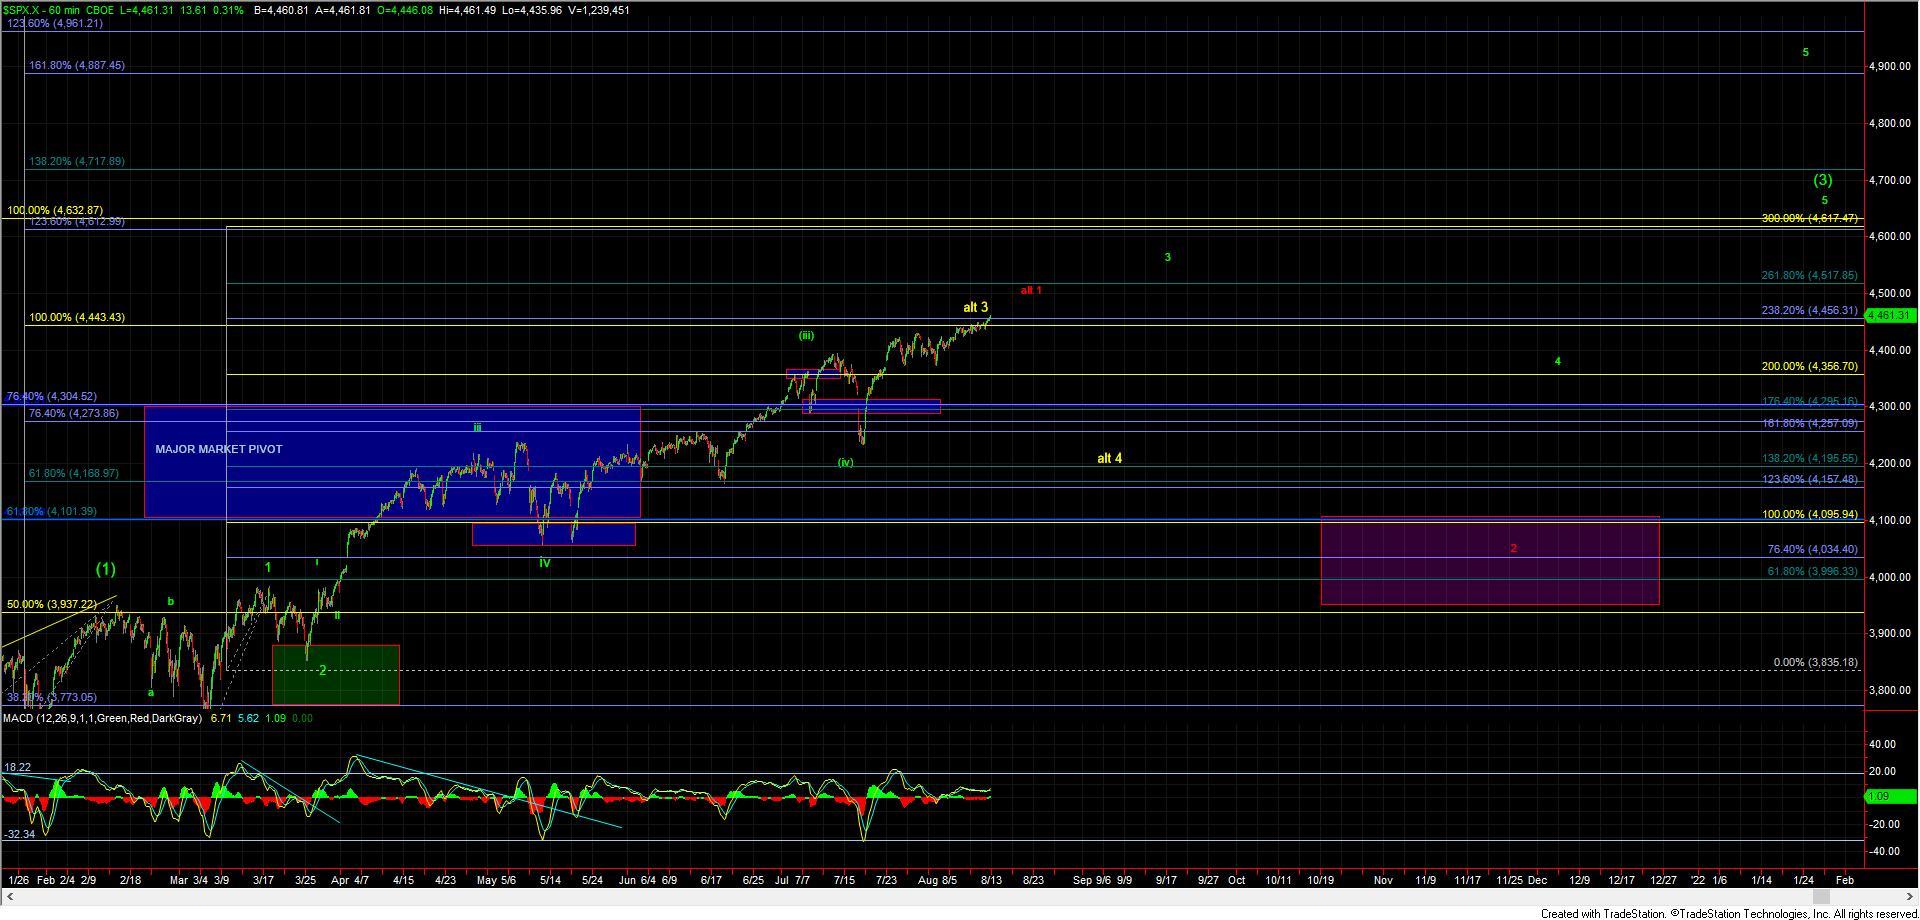
If all of those pivot levels are cleared then we simply can continue to move up our support levels as the ES/SPX pushes higher and approaches the 4500-4550 zone overhead and towards the topping region of the green wave 3 which can be seen on the SPX 60min chart.
If the market does indeed turn lower and breaks under the 4420 level followed by a break under the 4391 level and finally under the 4364 low then it would be the initial indication that the market will see a deeper pullback into the later part of the summer before it is ready to push higher once again. This pullback could take the shape of a larger degree wave 4 that could see a retest of the 4200 area that was struck back in mid-July. With that being said and as noted previously for now however and as long as we hold over support I am still leaning towards the more immediately bullish path shown in green.