SPX Broached Support – IWM Did Not
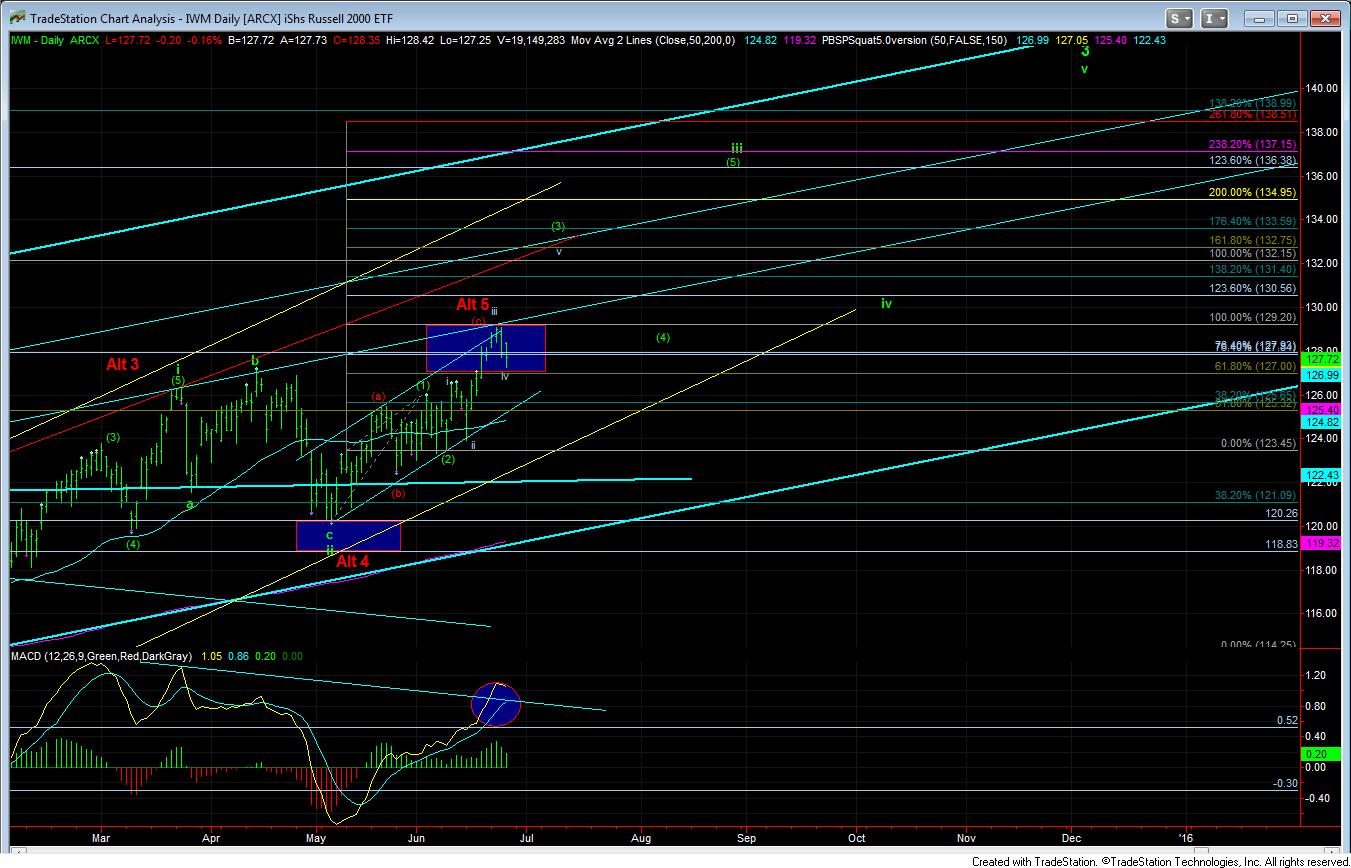
Well, maybe I should say that the IWM did not broach support as of yet. But, for now, it is holding its support in the 127 region.
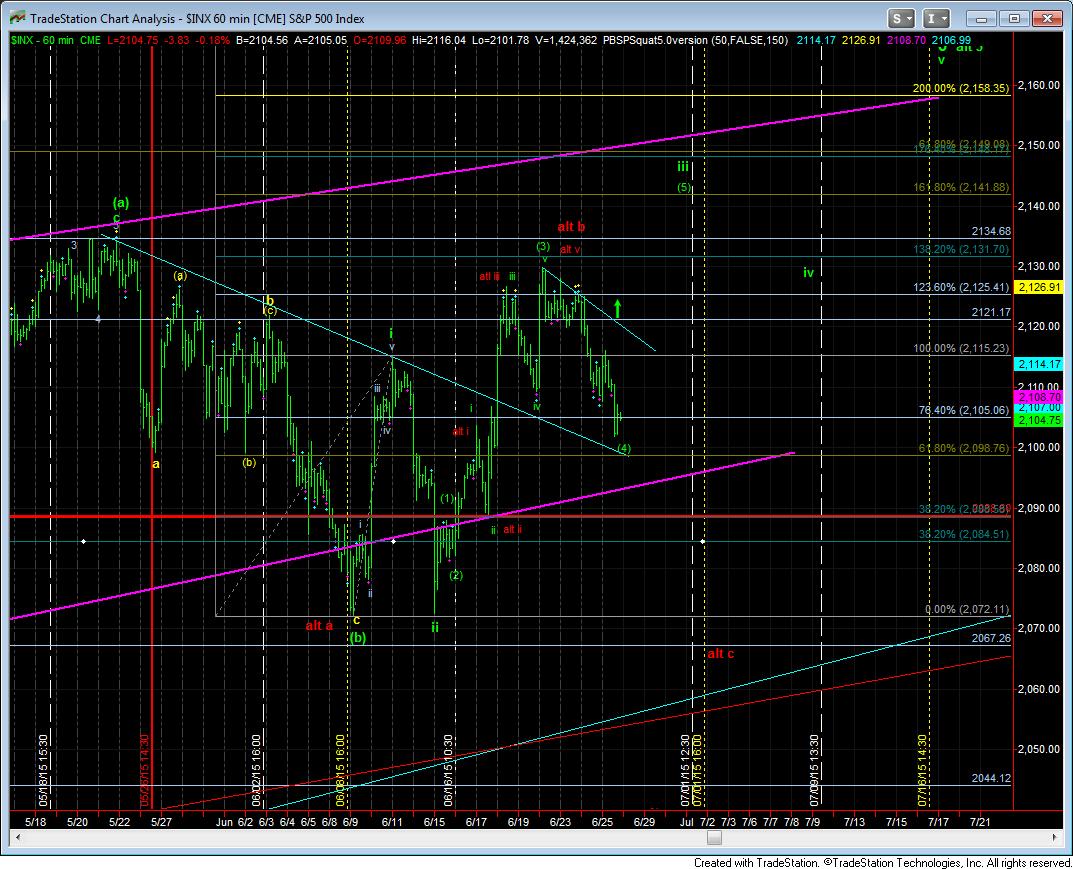
So, this allows me to take a moment and provide a little explanation regarding a question I received today. Over the weekend, I noted that a break of 2103.67 would invalidate the impulsive pattern. However, today we broke that level, but we did not invalidate the impulsive pattern. Let me explain why.
As we came into the week, the SPX counted as being in wave iv of wave (3) of green iii in the impulsive count. That being the case, wave iv could not overlap wave i, or else the impulsive pattern would be invalidated. It then began to rally on Monday without breaking into the high of wave i, and then completed wave v of wave (3). This then put us in wave (4) of a larger degree wave iii in green. Once we moved into that wave degree, then that wave (4) pullback would only invalidate by overlapping with wave (1). However, wave (1) of that degree is all the way down at the 2088SPX level. So, the market only dipped into the high of wave i of wave (3), which would not invalidate an impulsive pattern if we are no longer in that wave degree.
Please post questions in the room if this is not understood. Truthfully, one of the most difficult parts of learning Elliott Wave is keeping the wave degrees straight.
As for where we are now, well, the wave (4) of iii (after striking the 1.382 extension), really should not have dipped below the .764 extension on its pullback, and that was 2105SPX. More often than not, it is an early warning that this impulsive pattern will fail. However, I have been trying to maintain a dual perspective using both the IWM and the SPX. And, as I noted for quite some time, the IWM has to hold over its micro .618 extension at 127 to maintain a strong bullish bias, and, so far, it has.
So, if we were to see both the SPX and the IWM break their support regions, then I would move into an overall neutral stance on the market, as there are still bullish interpretations I would need to grapple with before aggressively shorting for 1800SPX.
Should both charts break their ideal support, the main level I will be watching is the 2067SPX level. That level represents an a=c calculation as I have now noted in red. It would take a break of that level (just 5 points lower than our prior support at 2072SPX) to convince me that the market is transitioning into the larger degree 4th wave to 1800. Until such time, there are very real bullish perspectives which can still take us to a higher high, and I would not be comfortable shorting the market until it is much more clear to me that the 1800 region is what the market is looking towards over the next several months. And, it still leaves us over 200 points of shorting room.