SPX Breaks Out To New HIghs While Nasdaq and The Russell Lag Behind
 By
By
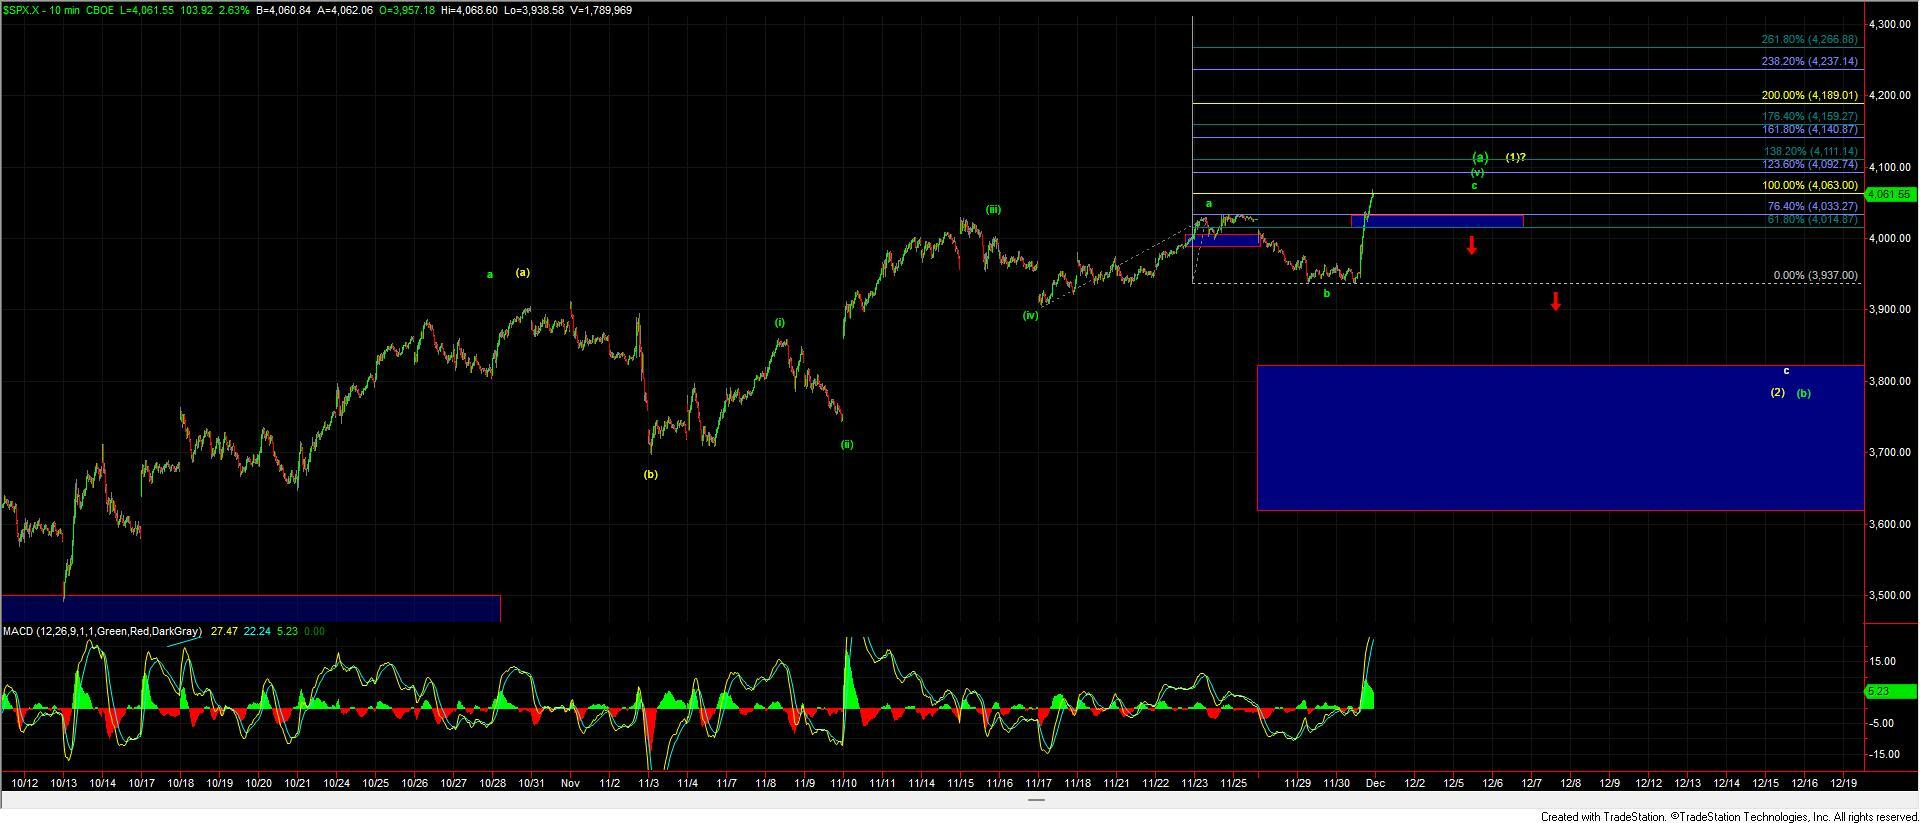
After moving lower over the past several days we saw the SPX breakout sharply higher in the afternoon session and push to a new local high over the high that was struck on 11/23. Furthermore, the ES finally broke over its previous high that was struck on 11/15 which is putting the SPX and the ES back in better alignment and now following a cleaner more consistent pattern with each other. While cleaning up the count between the SPX and the ES this push to new highs also cleans up the micro counts as we are now able to eliminate some of the more complex patterns and the higher high gives us a good reset of the count.
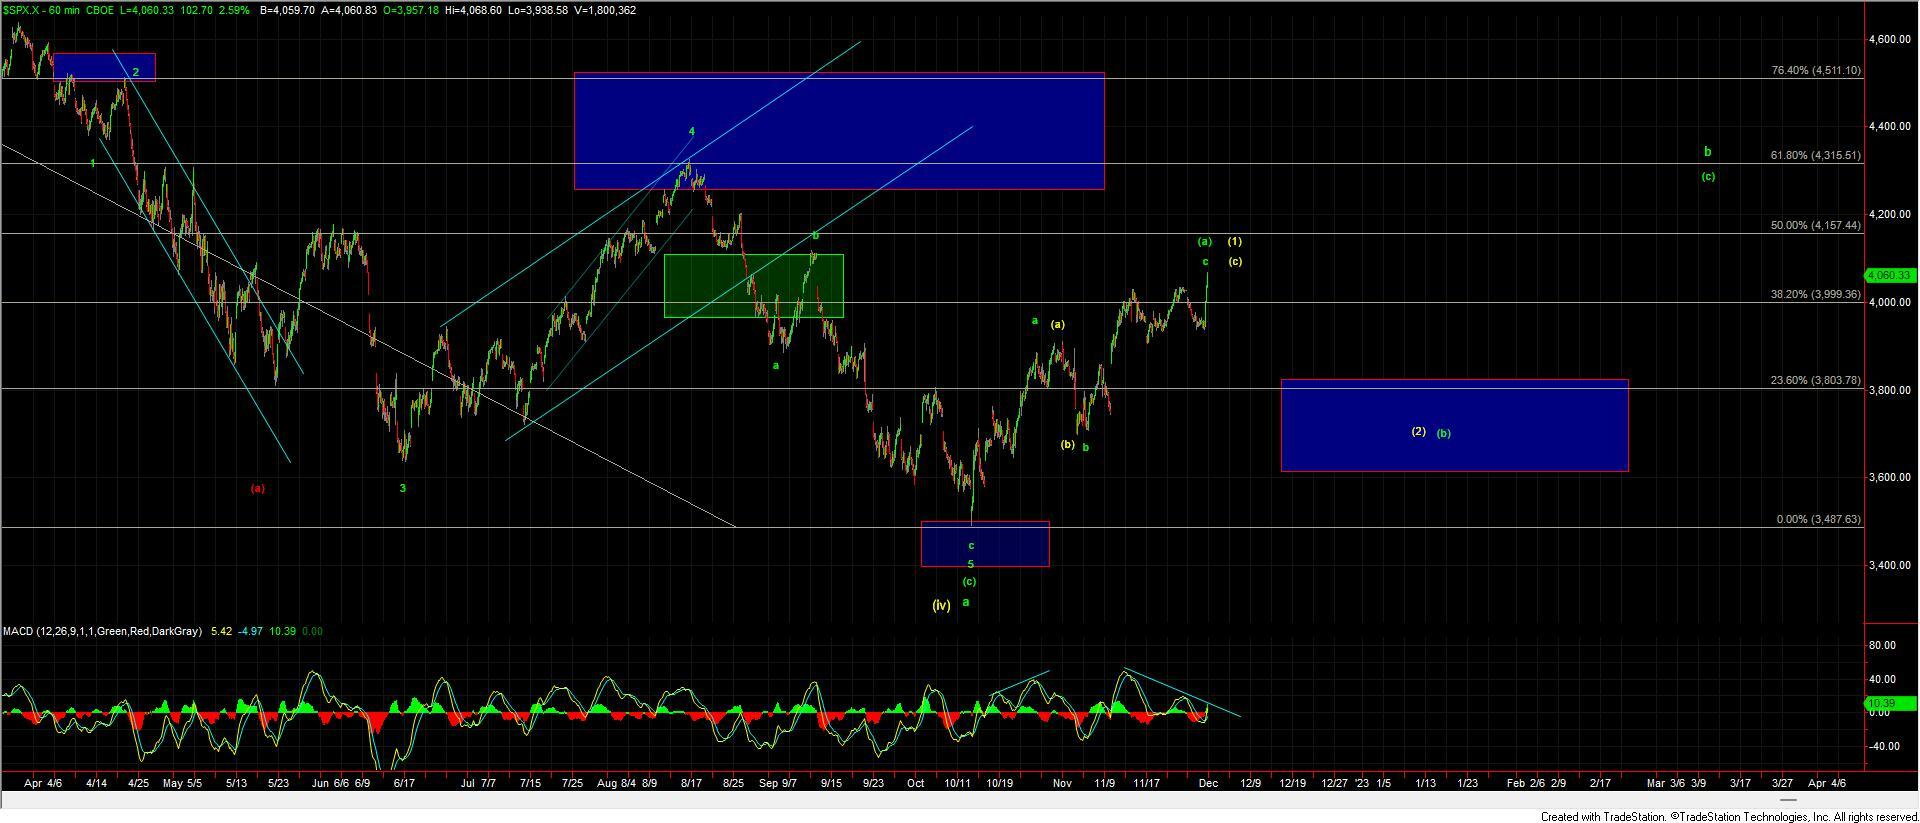
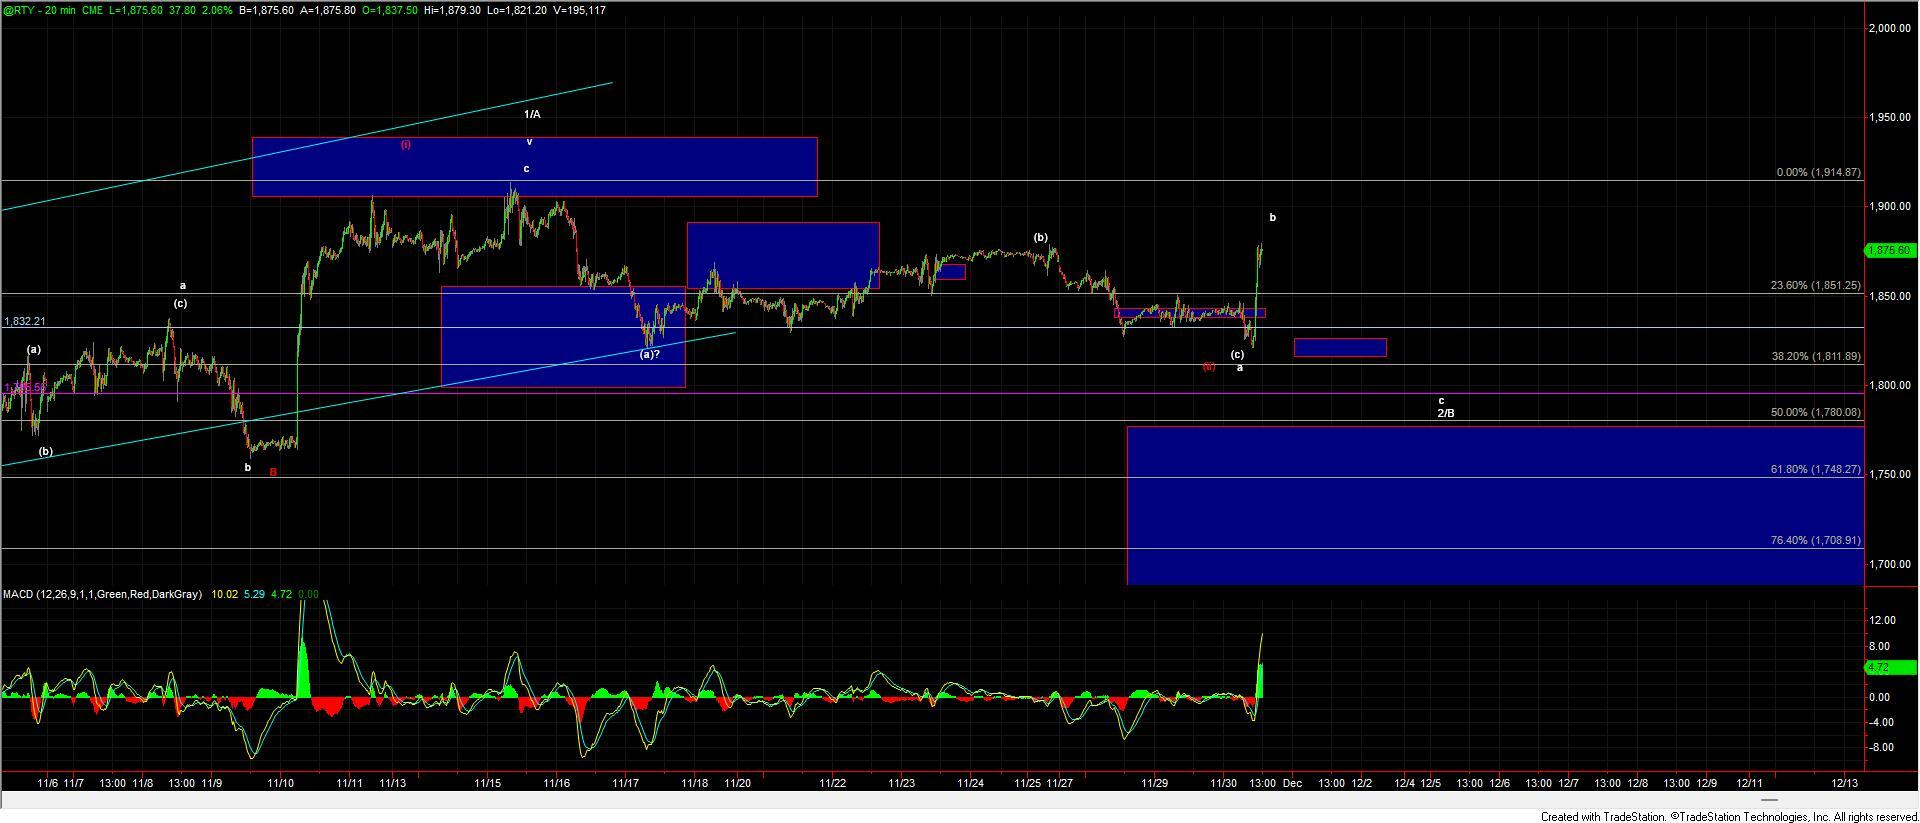
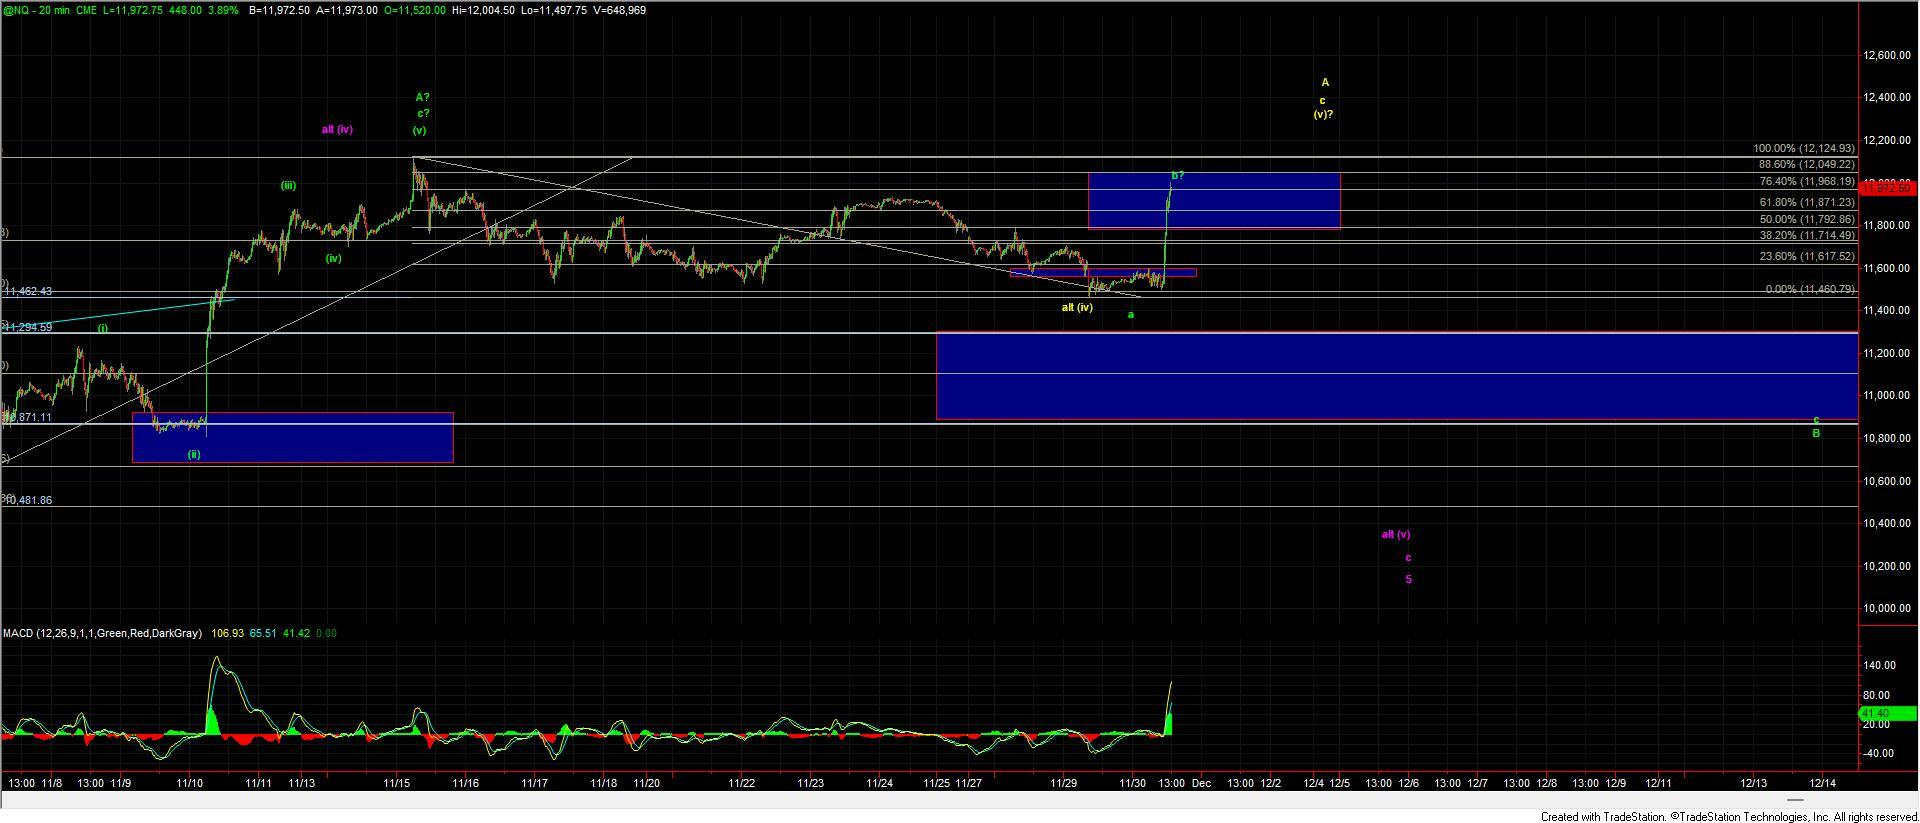
Bigger picture I am viewing this push to new highs as simply an extension of the wave (a) or the wave (1) so from that perspective, I do not view this as changing much on the bigger picture landscape. Also with the Russel and the Nasdaq still holding under their respective highs, I am still learning towards those instruments having already put in a top with this push to new highs on the SPX and ES simply giving us that extension of the previous larger degree count.
As I noted above bigger picture I still prefer to see this pullback before breaking out sharply to new highs. We do however need to see the SPX break back under the 4033-4014 zone to give us that initial signal that we have indeed topped in either the green wave (a) or yellow wave (1). This should then be followed up with a break back under the 3937 low which would then have us targeting the 3800-3600 region for that wave (2)/(b) pullback. This is fitting with what I am watching on both the Nasdaq and the Russell 2000 as again those instruments look to have already topped in their respective A waves and are still tracing out a fairly clean wave b of larger wave B at the moment.
So while this push to new highs was certainly quite strong today it has not changed much on the larger degree timeframes and the pattern is still suggestive that we will pullback over the next several weeks before seeing a strong breakout to the upside.