S&P 500 in Frustrating 4th Wave
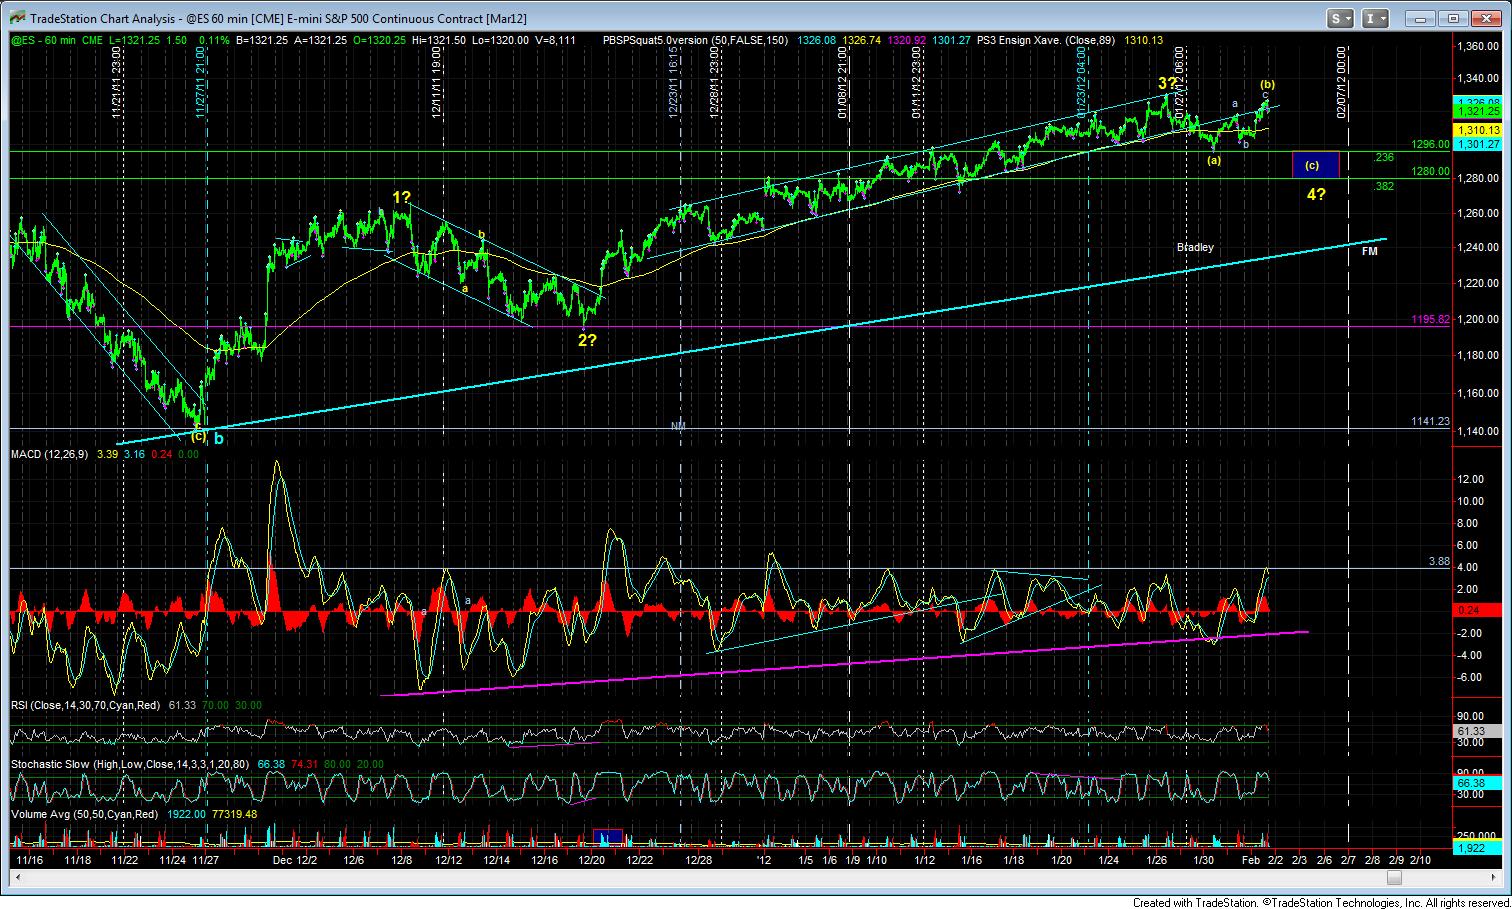
At this point, our primary count has us in a yellow (b) wave within a 4th wave of the final blue c-wave while we make our way to our expected top in March.
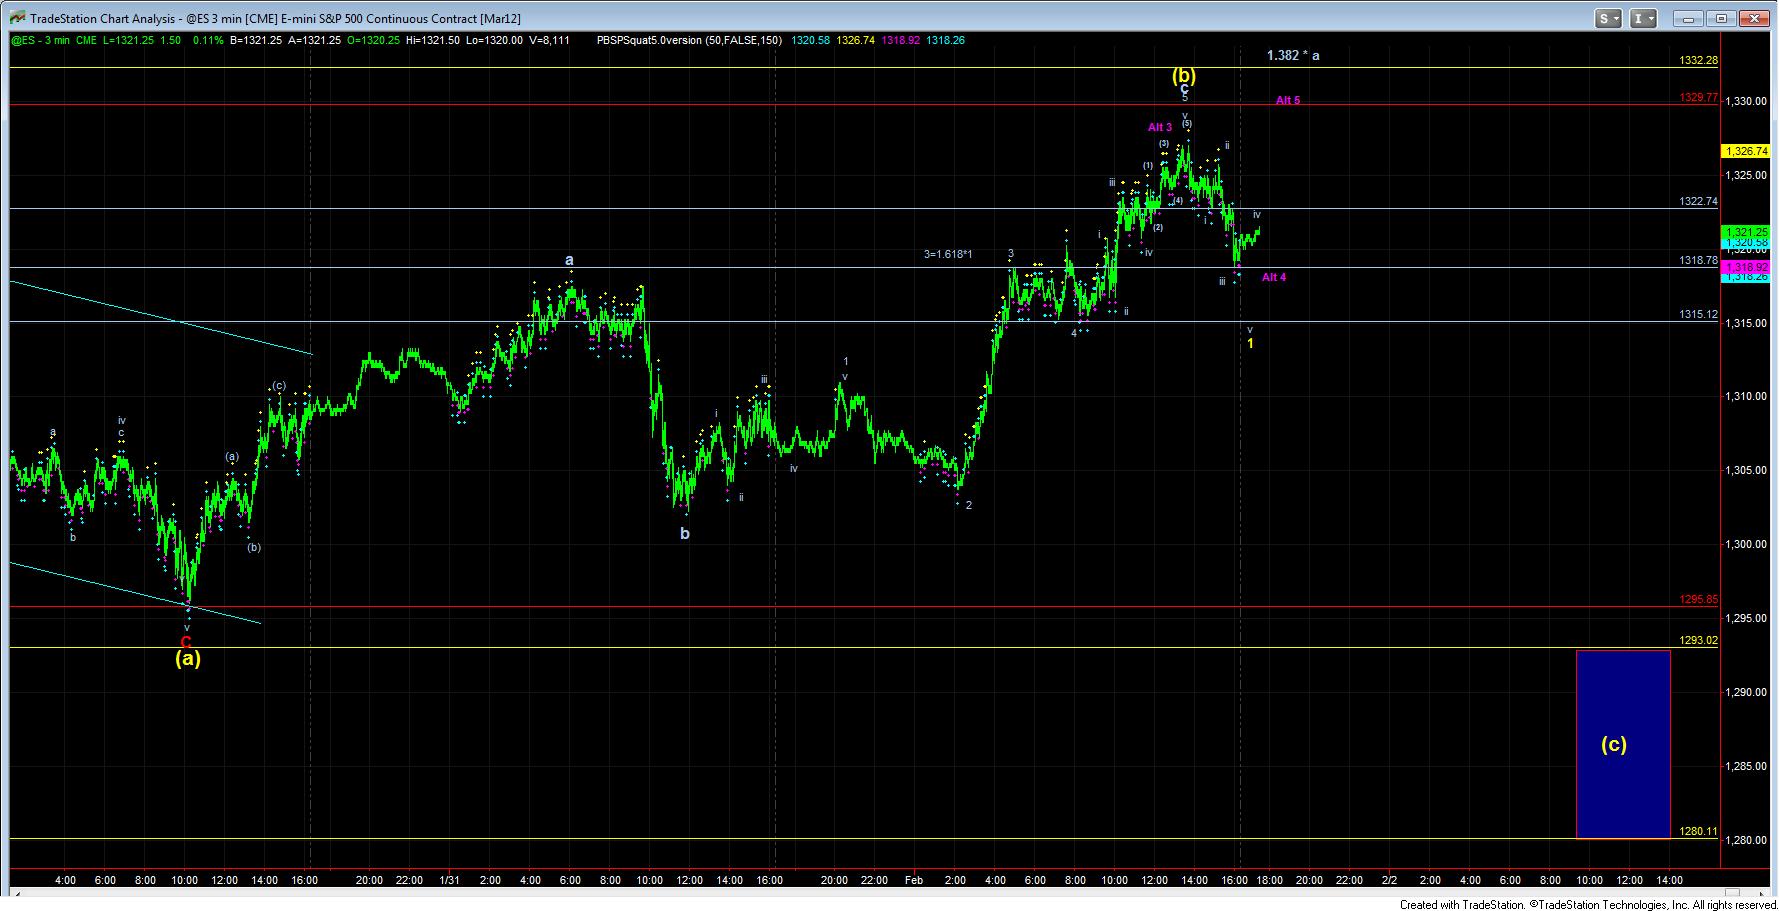
Within this (b) wave, our primary count has us either having topped out today in the c-wave of the (b) after a 5 wave move up from the prior low of 1302es, or we only completed 4 waves of that 5 wave structure.
At the end of the day, we began what could be a 5 wave move down from the peak we hit today. However, since only 3 waves down were completed by the end of the day, the market must consolidate in a wave iv, as depicted in the 3 minute chart, and not break into the price territory of wave 1 at 1322.75, before it makes a 5th wave down to complete wave 1 down of the yellow (c) wave.
However, if the market were to move over the 1322.75 level before another wave down, then the purple Alt 4 count would appropriately become the primary count, with a potential target as high as the 1329-1332es level, which would also be the region where the c-wave of this yellow (b) wave would be equal to 1.382 times the size of the a-wave.
After we complete this top, our expectation, based upon this pattern, would be a drop in a (c) wave, which is a 5 wave event. Our targets are identified on the 60 minute and 3 minute charts. The 1293es level would be where (a)=(c) based upon a top being made today, and the 1280es level would be where (c)=1.382*(a).
Again, as we have stated many, many times in the past, 4th waves can be quite frustrating since there is no specifically designated form it must take. In fact, there is still enough time for the market to form a 4th wave triangle in this region, which would then make the bottoming targets even higher than those just cited. In the event of a triangle, the likely target may not break the 1303-1307es region.
For now, let’s see if the market will give us a pattern to short at the open, as we had the opportunity to do yesterday.


