S&P 500 Target Levels
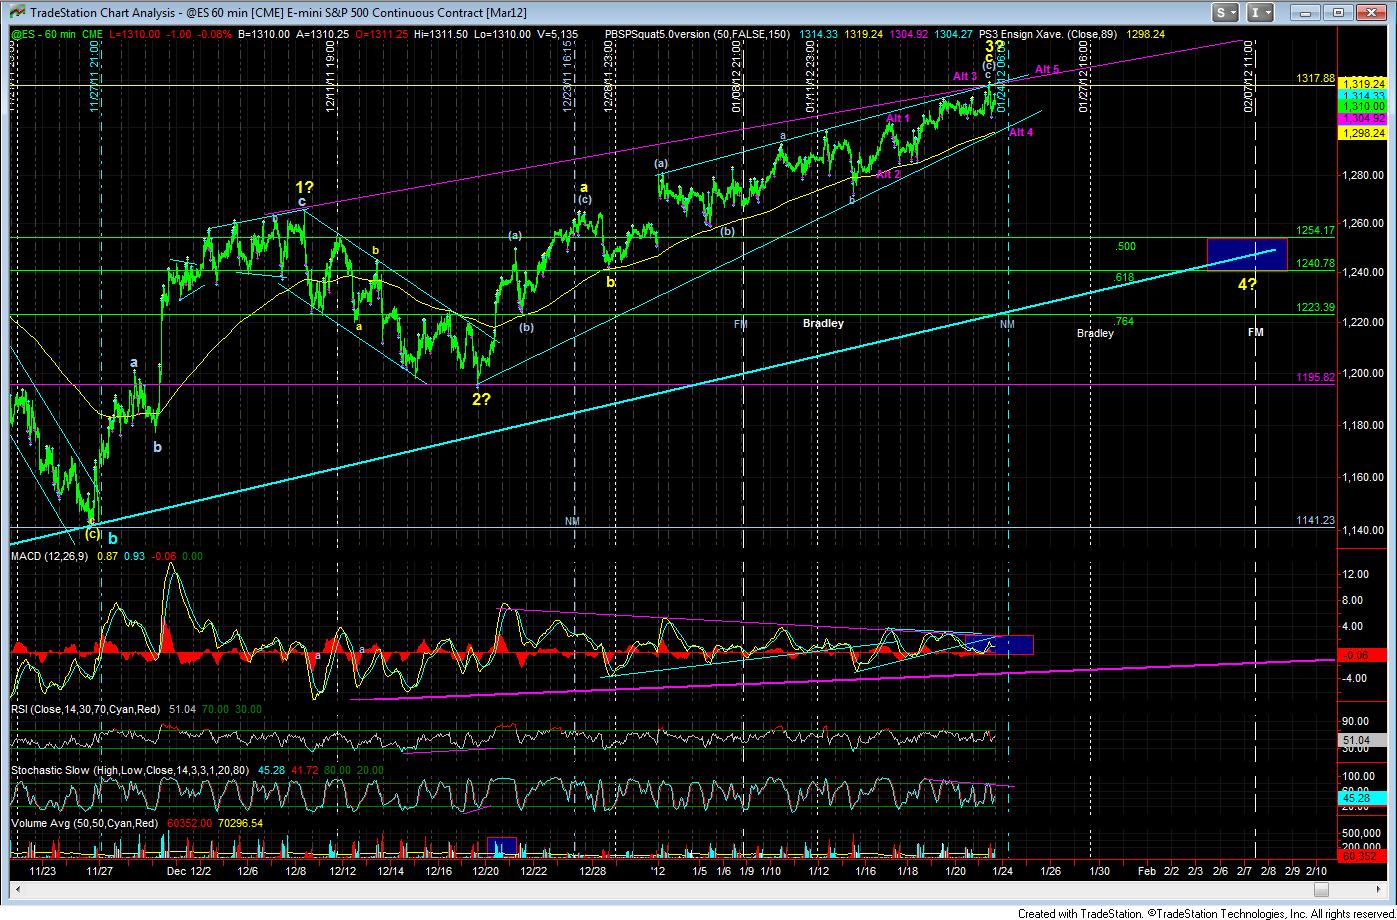
As of right now, we clearly have enough waves in place to consider this move up complete. Furthermore, we have come right into the Fib confluence region that we expected would give us a top to our market. The primary count now has the top in place.
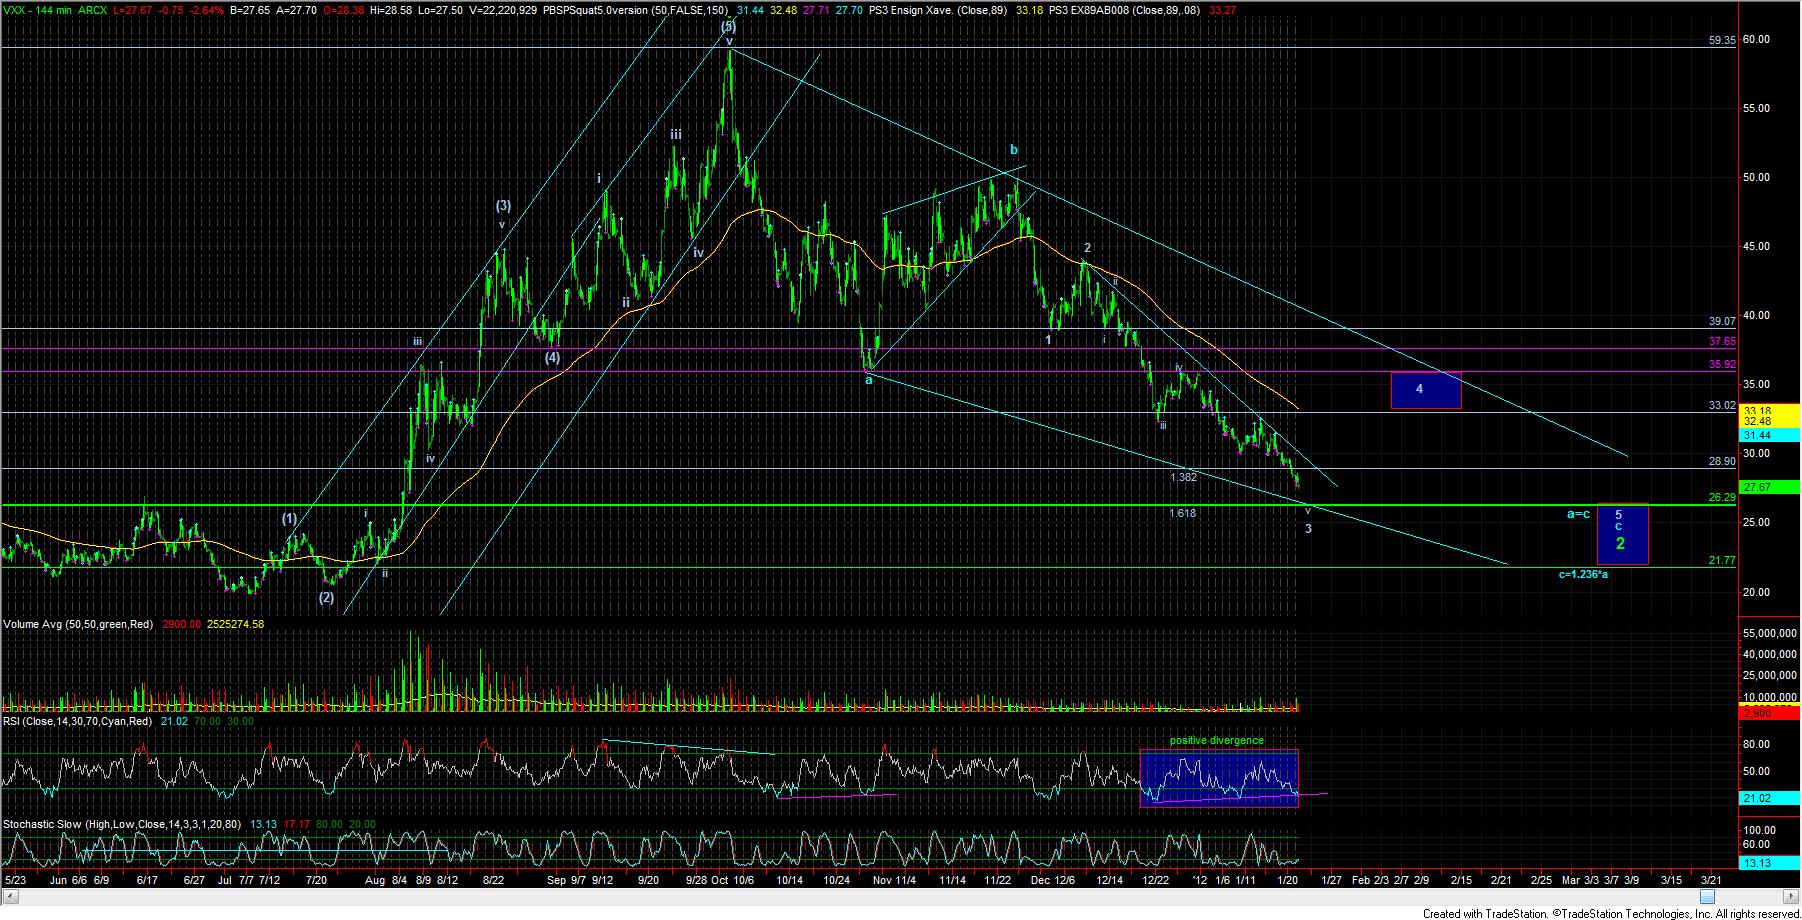
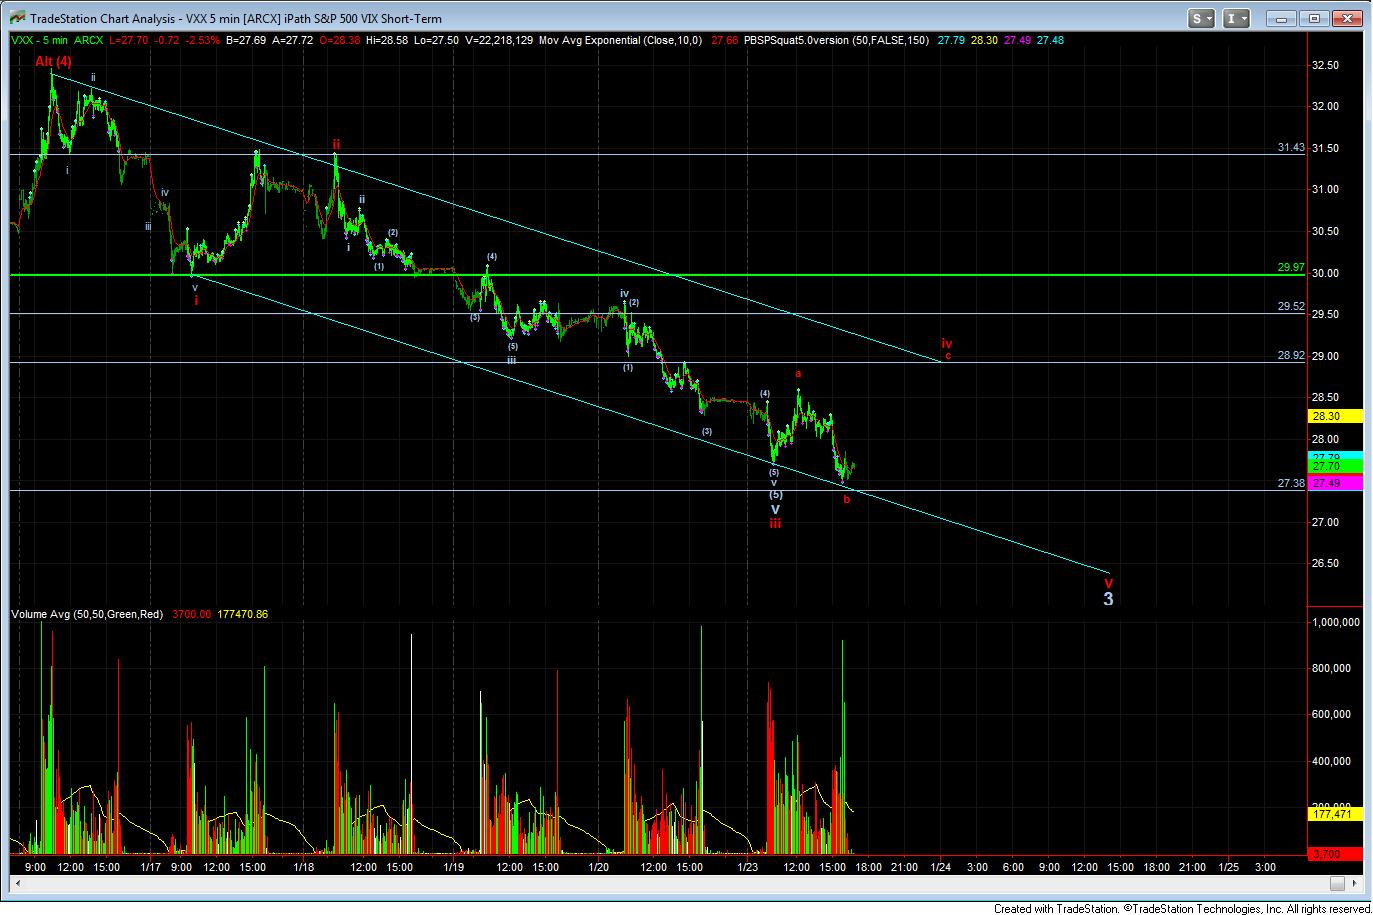
However, right now, I had to place the alternate count on the chart, as I am not convinced that the top is in place. If we look at the VXX count, it does seem as though the VXX will form the larger v-wave move in red, with the target as the 1.618 extension region for the Wave 3 down in the 26.35 region. This means that we should see one more rise in the VXX towards the 29.00 region, which is the 1.00 extension within that larger move down, as well as the level at which the c-wave will equal 1.618 times the size of the a-wave in the red wave iv. Thereafter, it would seem that we may see one final decline in the VXX towards our lower target, after that level is held as resistance for any move up. That would then give us a VERY complete 5 wave move for this 5th wave down of Wave 3.
The target levels for the move down at this time would be the 1300es region, where we would have two equal waves down from the top we made today, and we can even extend down to the 1296/97es region where the c-wave would be equal to 1.382 times the size of the a-wave down from the high today.
Of course, we can consider the high as being made today, but the pattern that the market made on its way down from the high did not count best as a 5 wave move down, but more like a 3 wave move down. Again, it leaves us wanting for proof that the high is actually in. Until such time, we cannot get too aggressive on the downside since we can still have one more rally. In fact, that rally may only create a double top, or a slightly higher top, but, it would still take another day or two until that top is made.
There were several technical items to take note of today. First, the MACD on the 60 minute chart is exhibiting serious negative divergence, especially on this new high made today, and could not even come up and test the underside of the uptrend channel if fell from at the end of last week.
Second, the VXX had a large volume spike that we normally see at the end of the move in the VXX. However, it is very possible that this spike was simply a spike in the wave v of red wave iii, with a wave iv and v yet to follow. Additionally, if you look at the Slow Stochastics, on the 144 minute chart, it is starting to turn up, which usually means that a 3rd wave has either completed or is probably about to complete. Usually, the Stochastics become embedded during a 3rd wave, and that supports the count that we only completed red wave iii today. Yet, the RSI is still exhibiting positive divergence on the 144 minute chart, which still means we are nearing the end of the move. But, positive divergence can be exhibited for some time before the market actually turns.
So for now, even though it is sometimes not easy, we still need a bit more patience as we await confirmation of a top in place, while the market meanders its way up to create the top we are expecting.