S&P 500 Breaks Out To New All-Time Highs And The Russell 2000 Tests A Key Pivot
 By
By
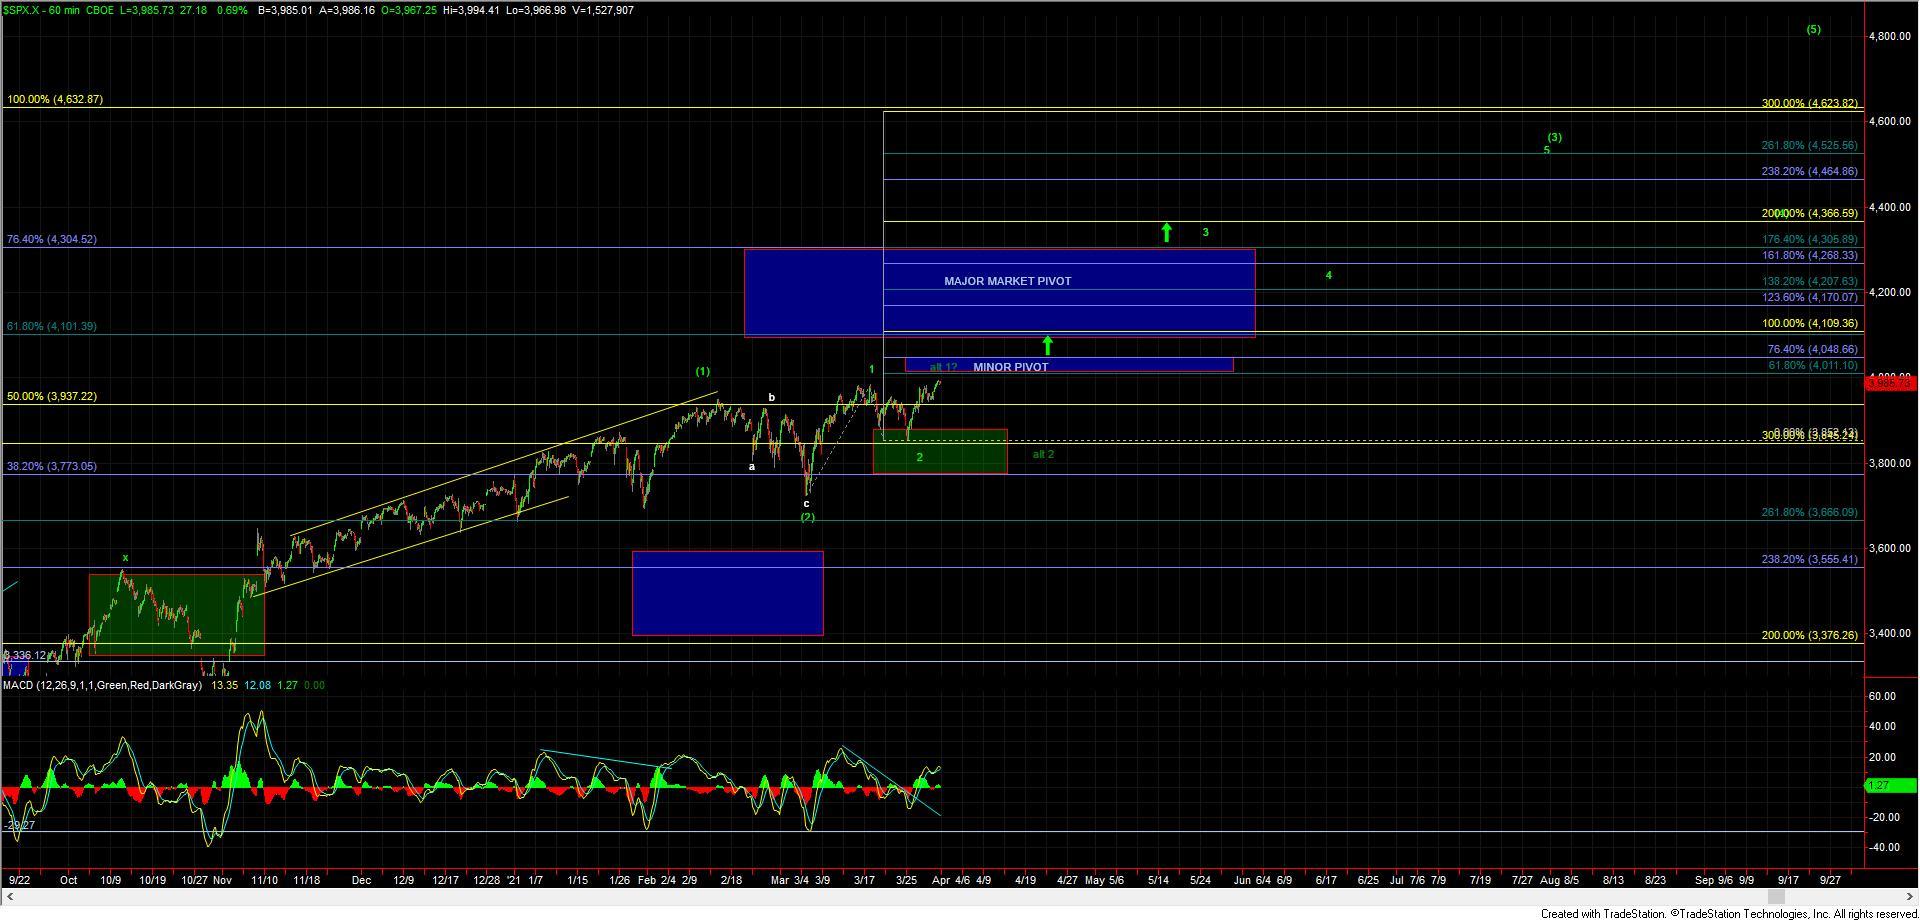
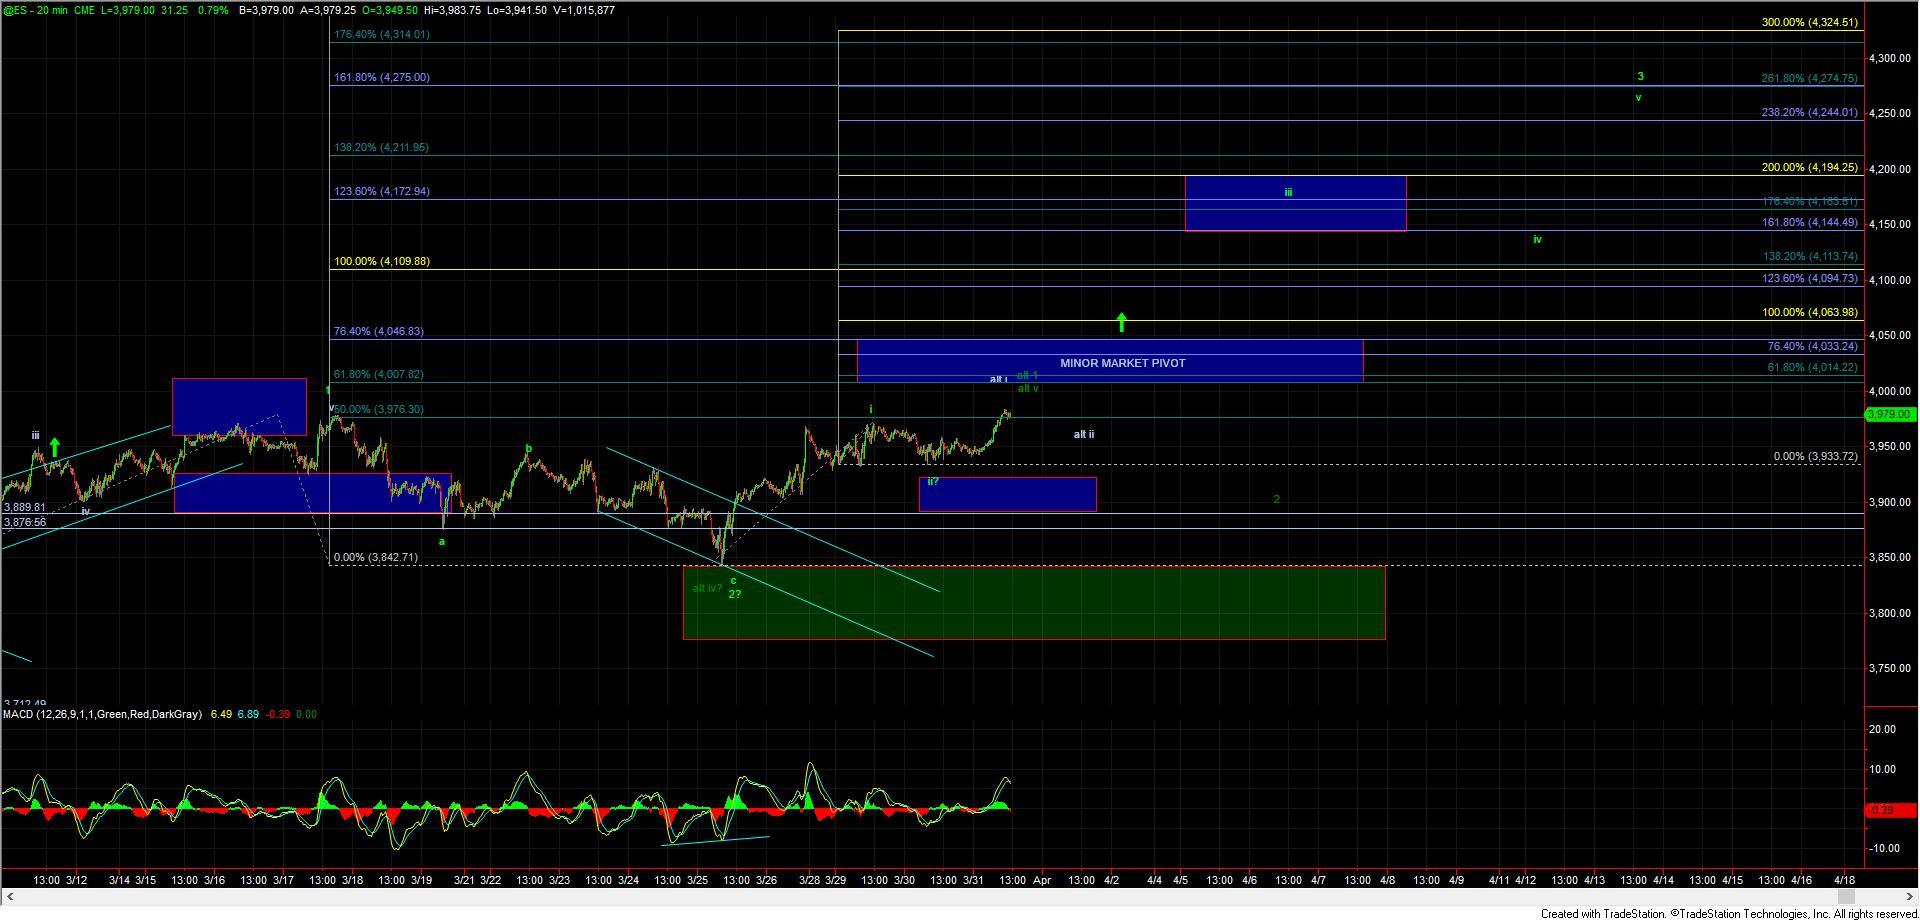
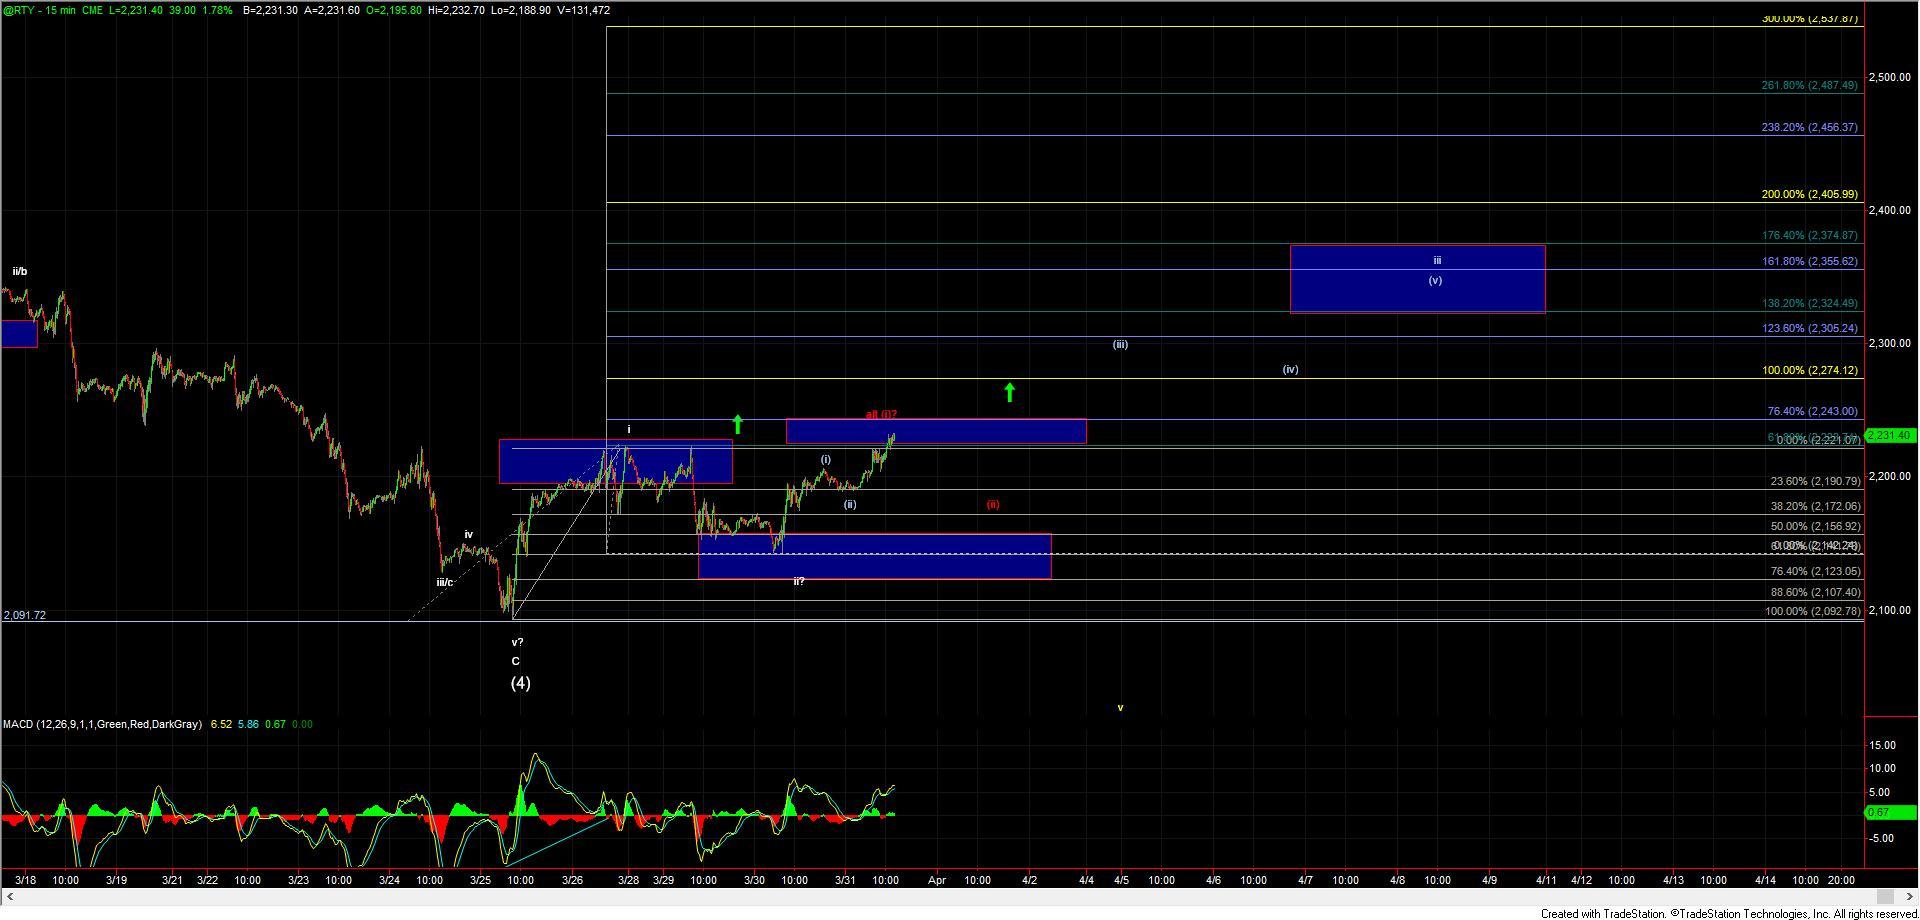
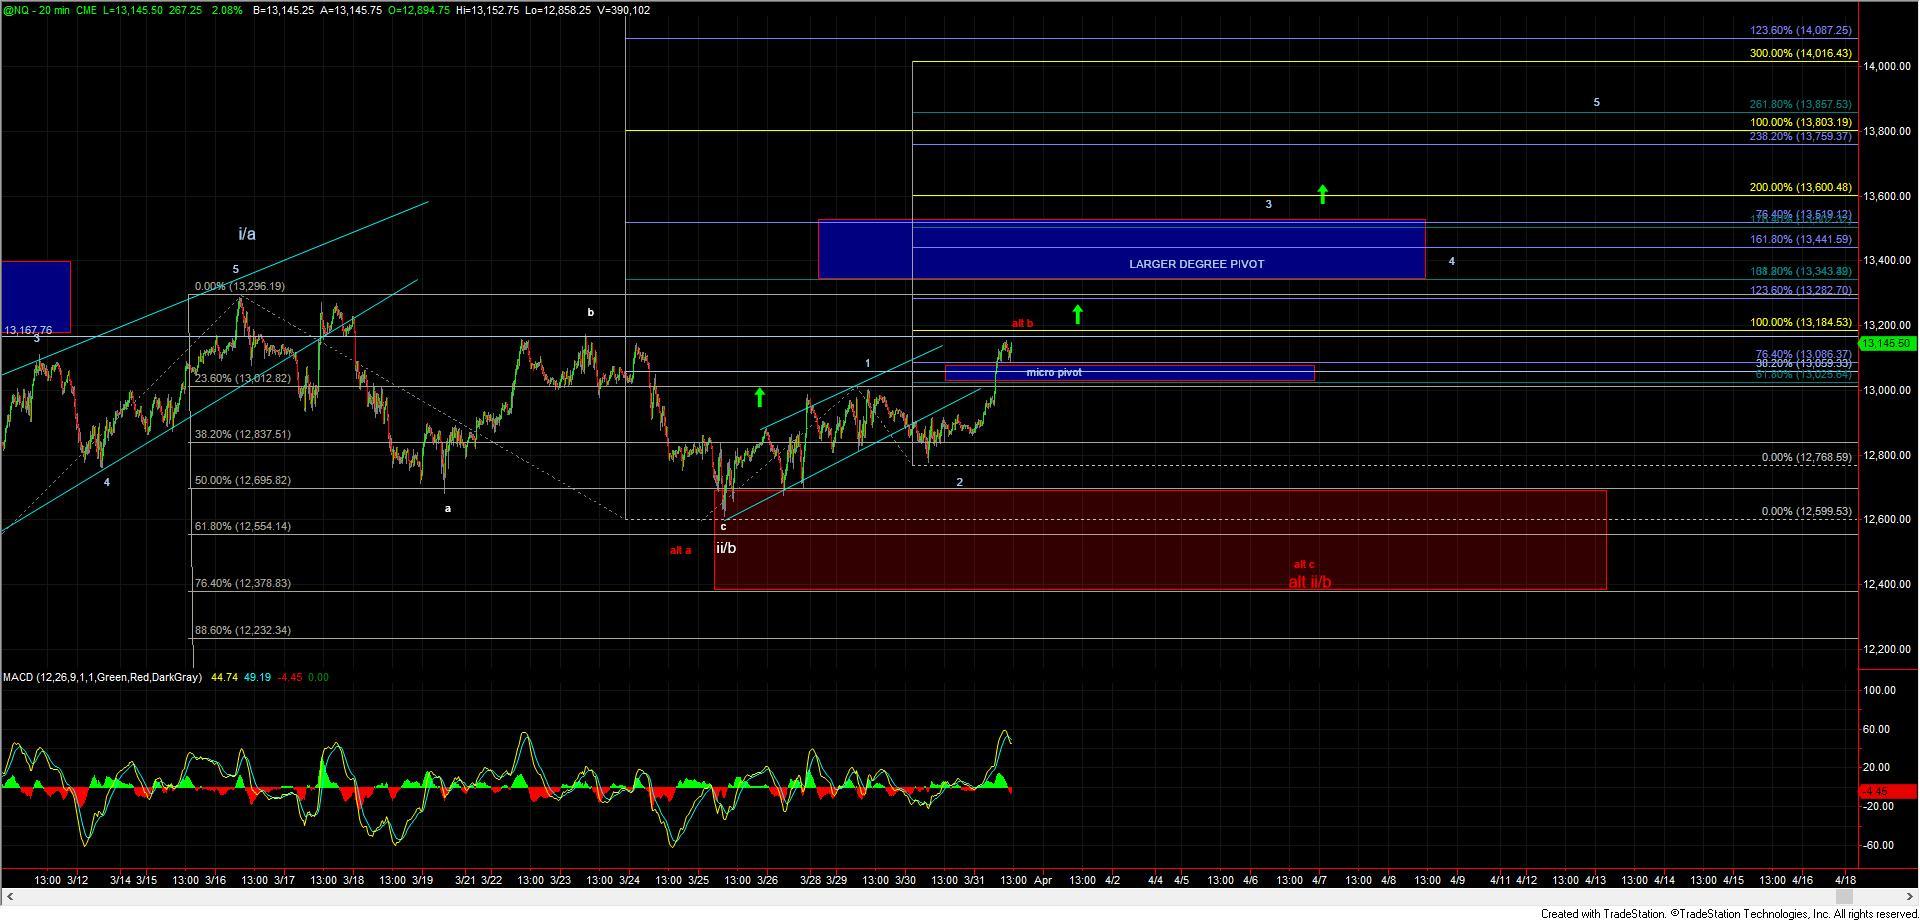
Today we saw a strong push higher across-the-board in all of the major equity indexes markets with the S&P 500 (SPX) seeing a breakout over the previous all-time-high at the 3985 level. From a pure percentage gan perspective we saw a very strong performance today in both the Nasdaq and the Russell 2000 with a move over 2% in the case of the Nasdaq and just under 2% for the Russell 2000.
These across-the-board breakouts are giving us further confirmation that we have indeed found a significant bottom with the lows that were struck last week as has been the base case for several days now. From here we have fairly clear parameters on all of the index charts to watch that should help give us further confirmation that a bottom has indeed been struck as we near both minor and major pivot levels on the three index charts.
Although the SPX has broken out to new highs I am still watching the 4011-4048 pivot level just overhead. If we can manage to see a sustained breakthrough this level then it would give us further confirmation that we have indeed bottomed in all of the green wave 2 thus putting us in the heart of wave 3 of (3) heading towards the 4268-2366 zone. This 4011-4048 pivot level has fib confluence on multiple timeframes so breaking through this level should allow for the SPX to see that fairly direct path up to those higher target levels.
Of course, once we do make it through the minor market pivot we still have one more major level to clear which comes in at the 4304 levels to really give us final confirmation that wave (3) has indeed begun. That being said as of right now we do have all of the signals in place to suggest that we should be testing these pivot levels in the coming weeks.
So while we are still not fully out of the woods and the market has a bit more work to do to prove this breakout will sustain itself, we really can't ask too much more from the market from a setup perspective. From here we simply need to continue to watch the very clear parameters that the charts are providing us we move into the weeks and months ahead.