Risks Rise Along With The Market As FOMO Becomes Palpable
 By
By
Market and Other Sentiment Indicators
Today we saw the market spike higher at the open extending yet further beyond the ideal upper target of 4100-4150 when we were trading near the lows around 3700. At the time of the lows most were calling for further market downside if not all out collapse. The fear of a continued downward spiral was palatable. Over the past several days we have also seen fear amongst many as the market continued to exceed the ideal upside target by around 100 points. That fear of course was the Fear of Missing Out.
Strong emotions are natural and common amongst market participants and in fact, the sentiment behind these emotions is what drives the markets and allows us to use Elliott Wave Analysis and Fibonacci Pinball to track and project where the market is likely heading. This analysis and not emotion is what allowed us to call for a bottom near the 3700 region and a move up into the 4100-4150 and is what is allowing us to consider this region as (although extended beyond the ideal target) as a topping area and region to which presents a fair amount of risk.
What you need to ask yourself as an investor and a trader is are you making trading decisions based on a systematic method that ignores the natural emotions that we all have as humans when it comes to the markets and our money or are you simply participating in the hearing effect that causes most individual and institutional investors to underperform the markets over the long run. Only those who are able to separate emotion from their decision-making will be able to succeed at this over the course of the long run and while we will never be perfect the methodology that we use to track the markets gives us the ability to remove emotion from the decision investment and trading decision making and make decisions based on a rational and systematic approach in what can otherwise seem like a chaotic and irrational market.
Current Market Conditions and Where We Are Heading
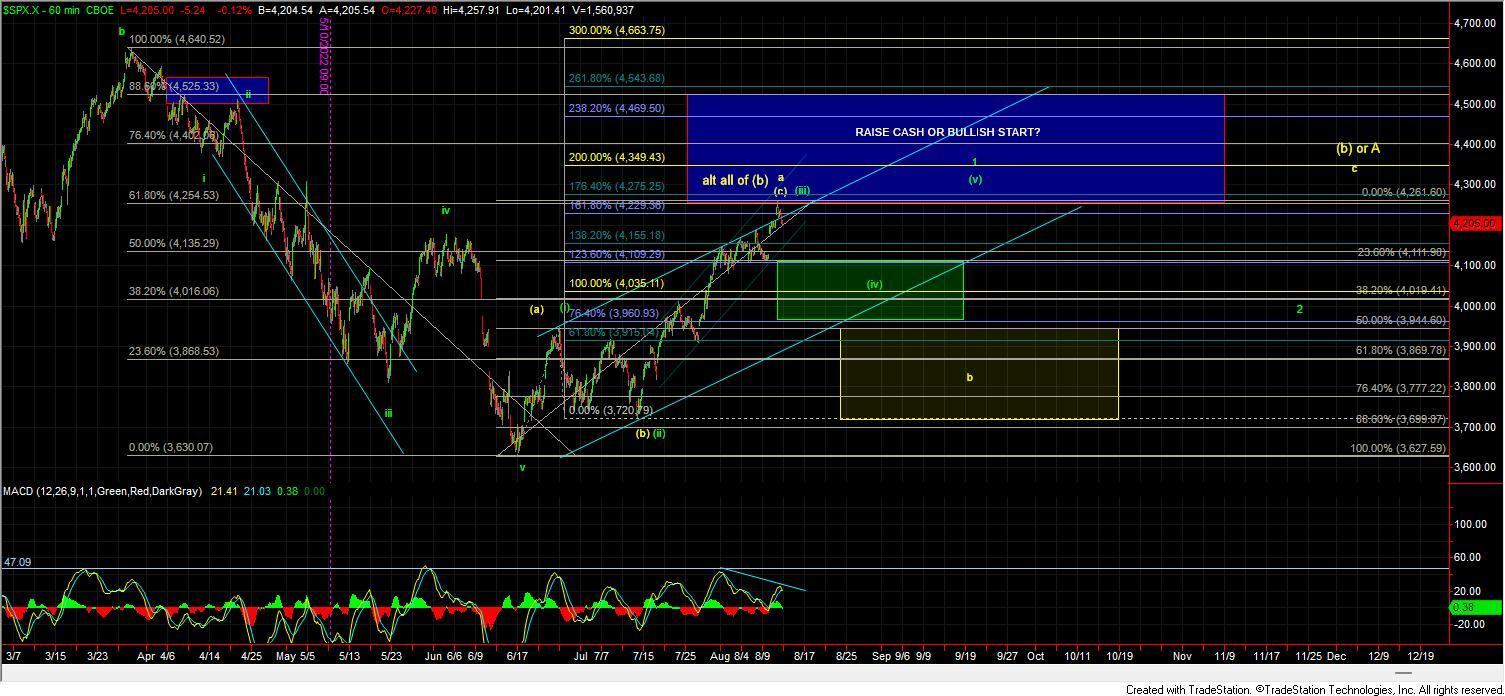
As I noted above, while the price action today did continue to extend higher above the original target zone of 4100-4150 the overall count has not changed from what we have been presenting over the past several weeks. What has occurred with this continued move up is we have increased the overall risks in the market. The reason for this is quite simple, in that while certainly an impressive run off of the lows, the structure of that move still only consists of three waves. While our base case is that the lows in June were in fact the bottom of a larger degree wave 4 the fact that we still only have three waves up off of the lows, and all of the subdivisions within that three wave move, are counting best as also being three waves. This is not a pattern to which we can say with a high degree of confidence that wave 4 per the green count is indeed in place, and we have the all-clear to new all-time highs. So while we still can lean towards the bottom being in as it is still the best pattern that is currently on the board it is far from ideal and not without its issues.
The push higher today also touched the 61.8 retrace of the entire move down off of the 4640 high on what is again only three waves. The push to that level now has opened the door to not only this moving lower per that yellow count below the 3950-3900 region as part of a wave b of larger wave (b), but also having potentially formed a top in all of the wave (b) as we are now trading at the lower end of the "RAISE CASH OR BULLISH START" resistance zone. Although we are in that zone because we are in that zone on only three waves the "BULLISH START" portion of that zone does not apply yet. For this move up into this zone to be the "BULLISH START" we still would need to see another wave (iv) down and (v) up as we have been laying out on the green count. If we can see that then we would look for a fairly larger wave 2 likely into the latter part of this year which would then set up a push to new all-time-highs. Until we see that occur and as long as we only have three waves up into this region there is still a significant amount of risk in this region. If we can get the retrace for the wave (iv) and then another higher high that risk will certainly be decreased but until that occurs we will continue to follow the analysis as we see it and present the most probable counts as we see them.
Furthermore in regards to the potential for all of the wave (b) to be in place if the market were to see a full five down off of the highs then the potential for this count to become operative will increase. For now however and as long as the action down remains corrective in nature my base case will remain that we will still see higher levels over current levels before the market breaks back below the June lows. This will however likely come after a pullback in either the green count with support in the 4111-3960 region or the yellow count with support in the 3944-3699 zone.
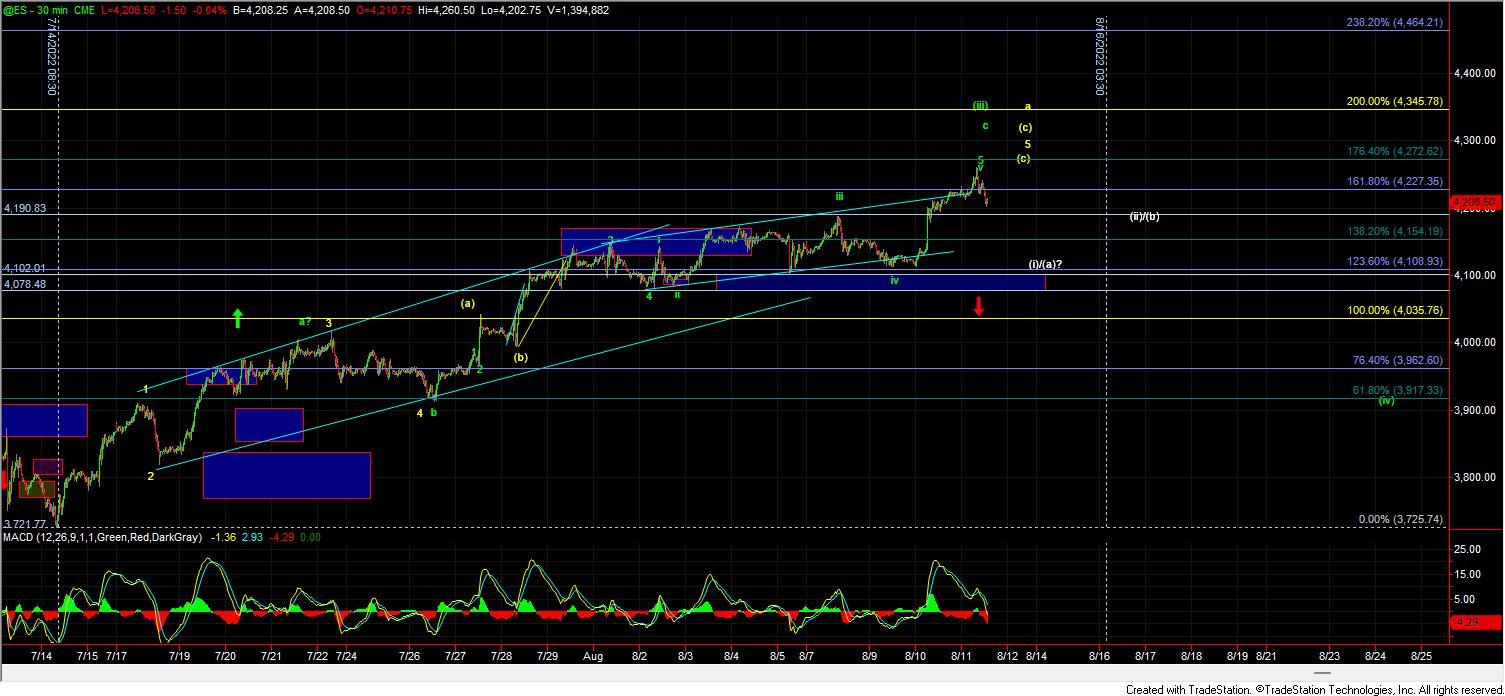
In regards to signaling a top, the parameters remain for the most part unchanged from my previous updates. I still am looking for a break of the 4102-4077 zone to give us confirmation that a top is indeed in place. If we see the initial move down off of the highs develop a full five-wave move then that would also give us further evidence of a top however a five wave start is certainly not required in this pattern. Furthermore, I do want to note that the MACD on the 60min SPX chart has now rolled over and is on the edge of crossing over on what is a fairly strong negative divergence. So while we still do not quite yet have confirmation of a top, the full pattern, the overbought conditions, negative divergence, and rejection off of key resistance levels are certainly giving me no reason to change the counts which are still looking for a pullback at this point in time. If we do continue to push higher over the course of the next several days, that move will continue to be only on three waves, and would still count as an extension of the wave (c)/(iii). It will not change the overall perspective as we move into the "RAISE CASH" zone that Avi had laid out quite some time ago.
Final Thoughts
I will leave you with my final quote from The Socionomic Theory of Finance which I will often repost from time to time in the room:
"The vast majority of speculators, who buy when prices are elevated and sell when the markets falls, do not feel nervous and fearful upon acting; they feel relieved. They do not know then have actually increased their chances of losing or reduced their chances of gaining because unconsciously they have acted to reduce the discomforting feeling of missing out on gains or risking losses. Because their risk actually increases by both sets of actions, we may confidently conclude that such behavior is non-rational.
If you want to meet speculators who consciously take on risk, seek out the few who buy when others are panicking or sell short when the crowd is giddy. On taking the action, they will be nervous if not downright fearful, because the conscious portion of their minds understands they are taking on risk, and the unconscious portion is screaming not to do it."