Risk Is Now Rising Again
 By
Avi Gilburt
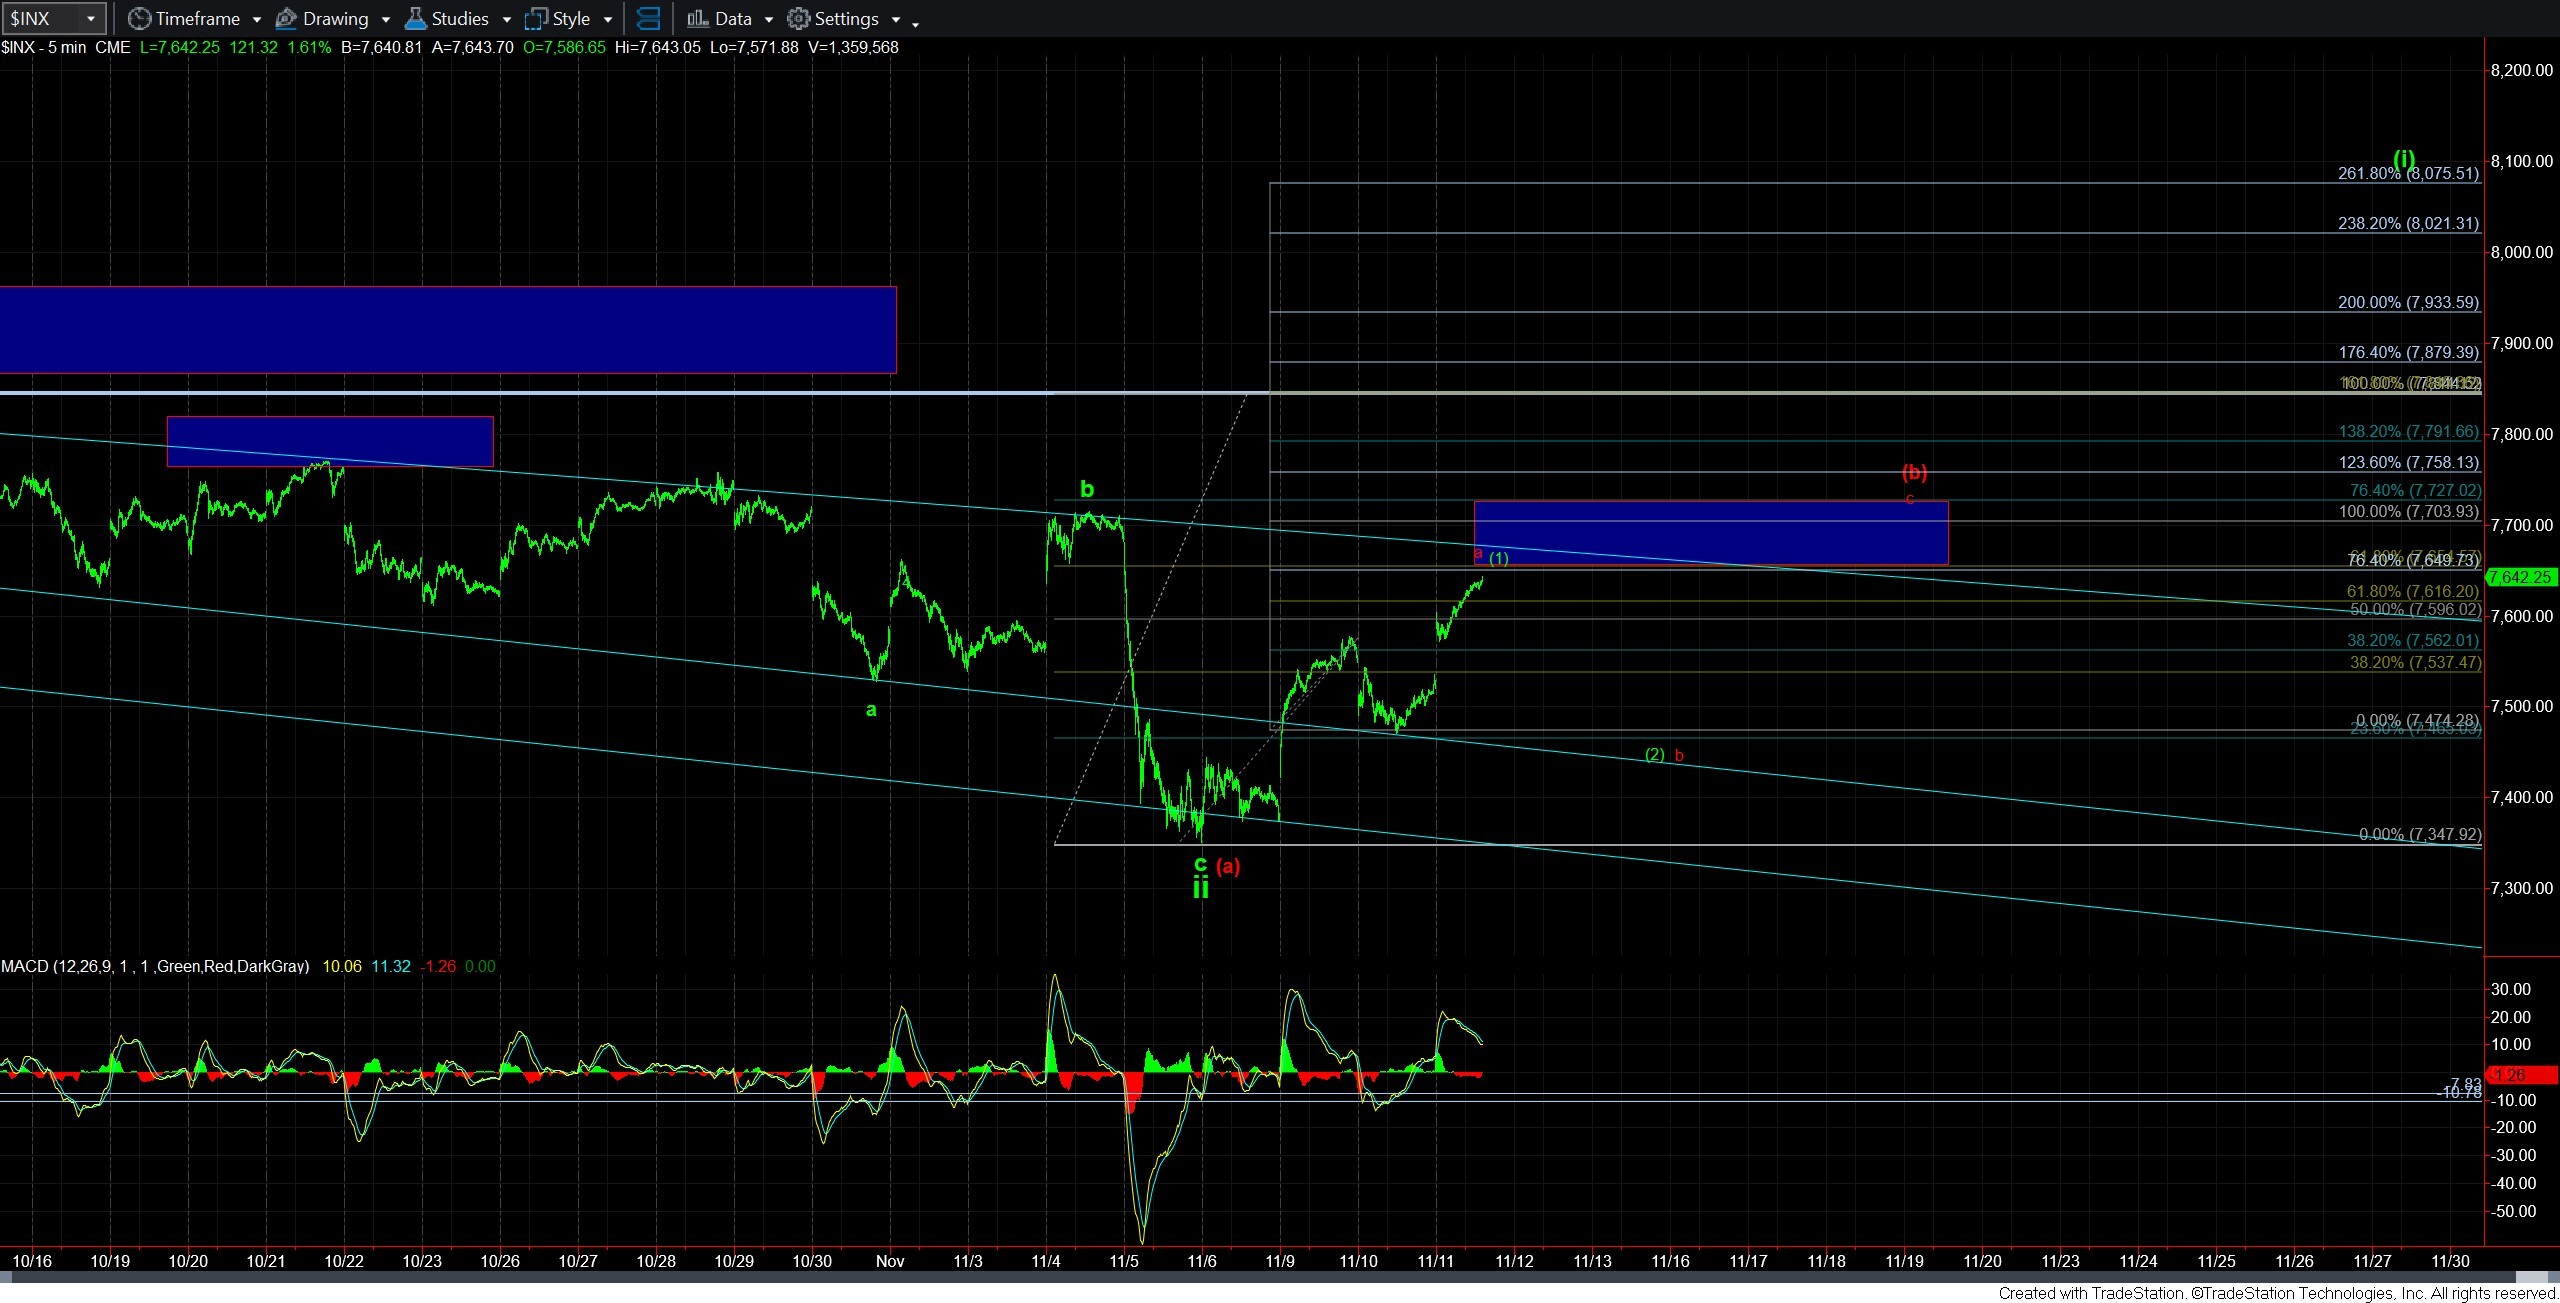
With the market now pressing higher as per our expectations, we have two paths in the micro count. And, I am putting this update our early because we are at a potential point of completion.
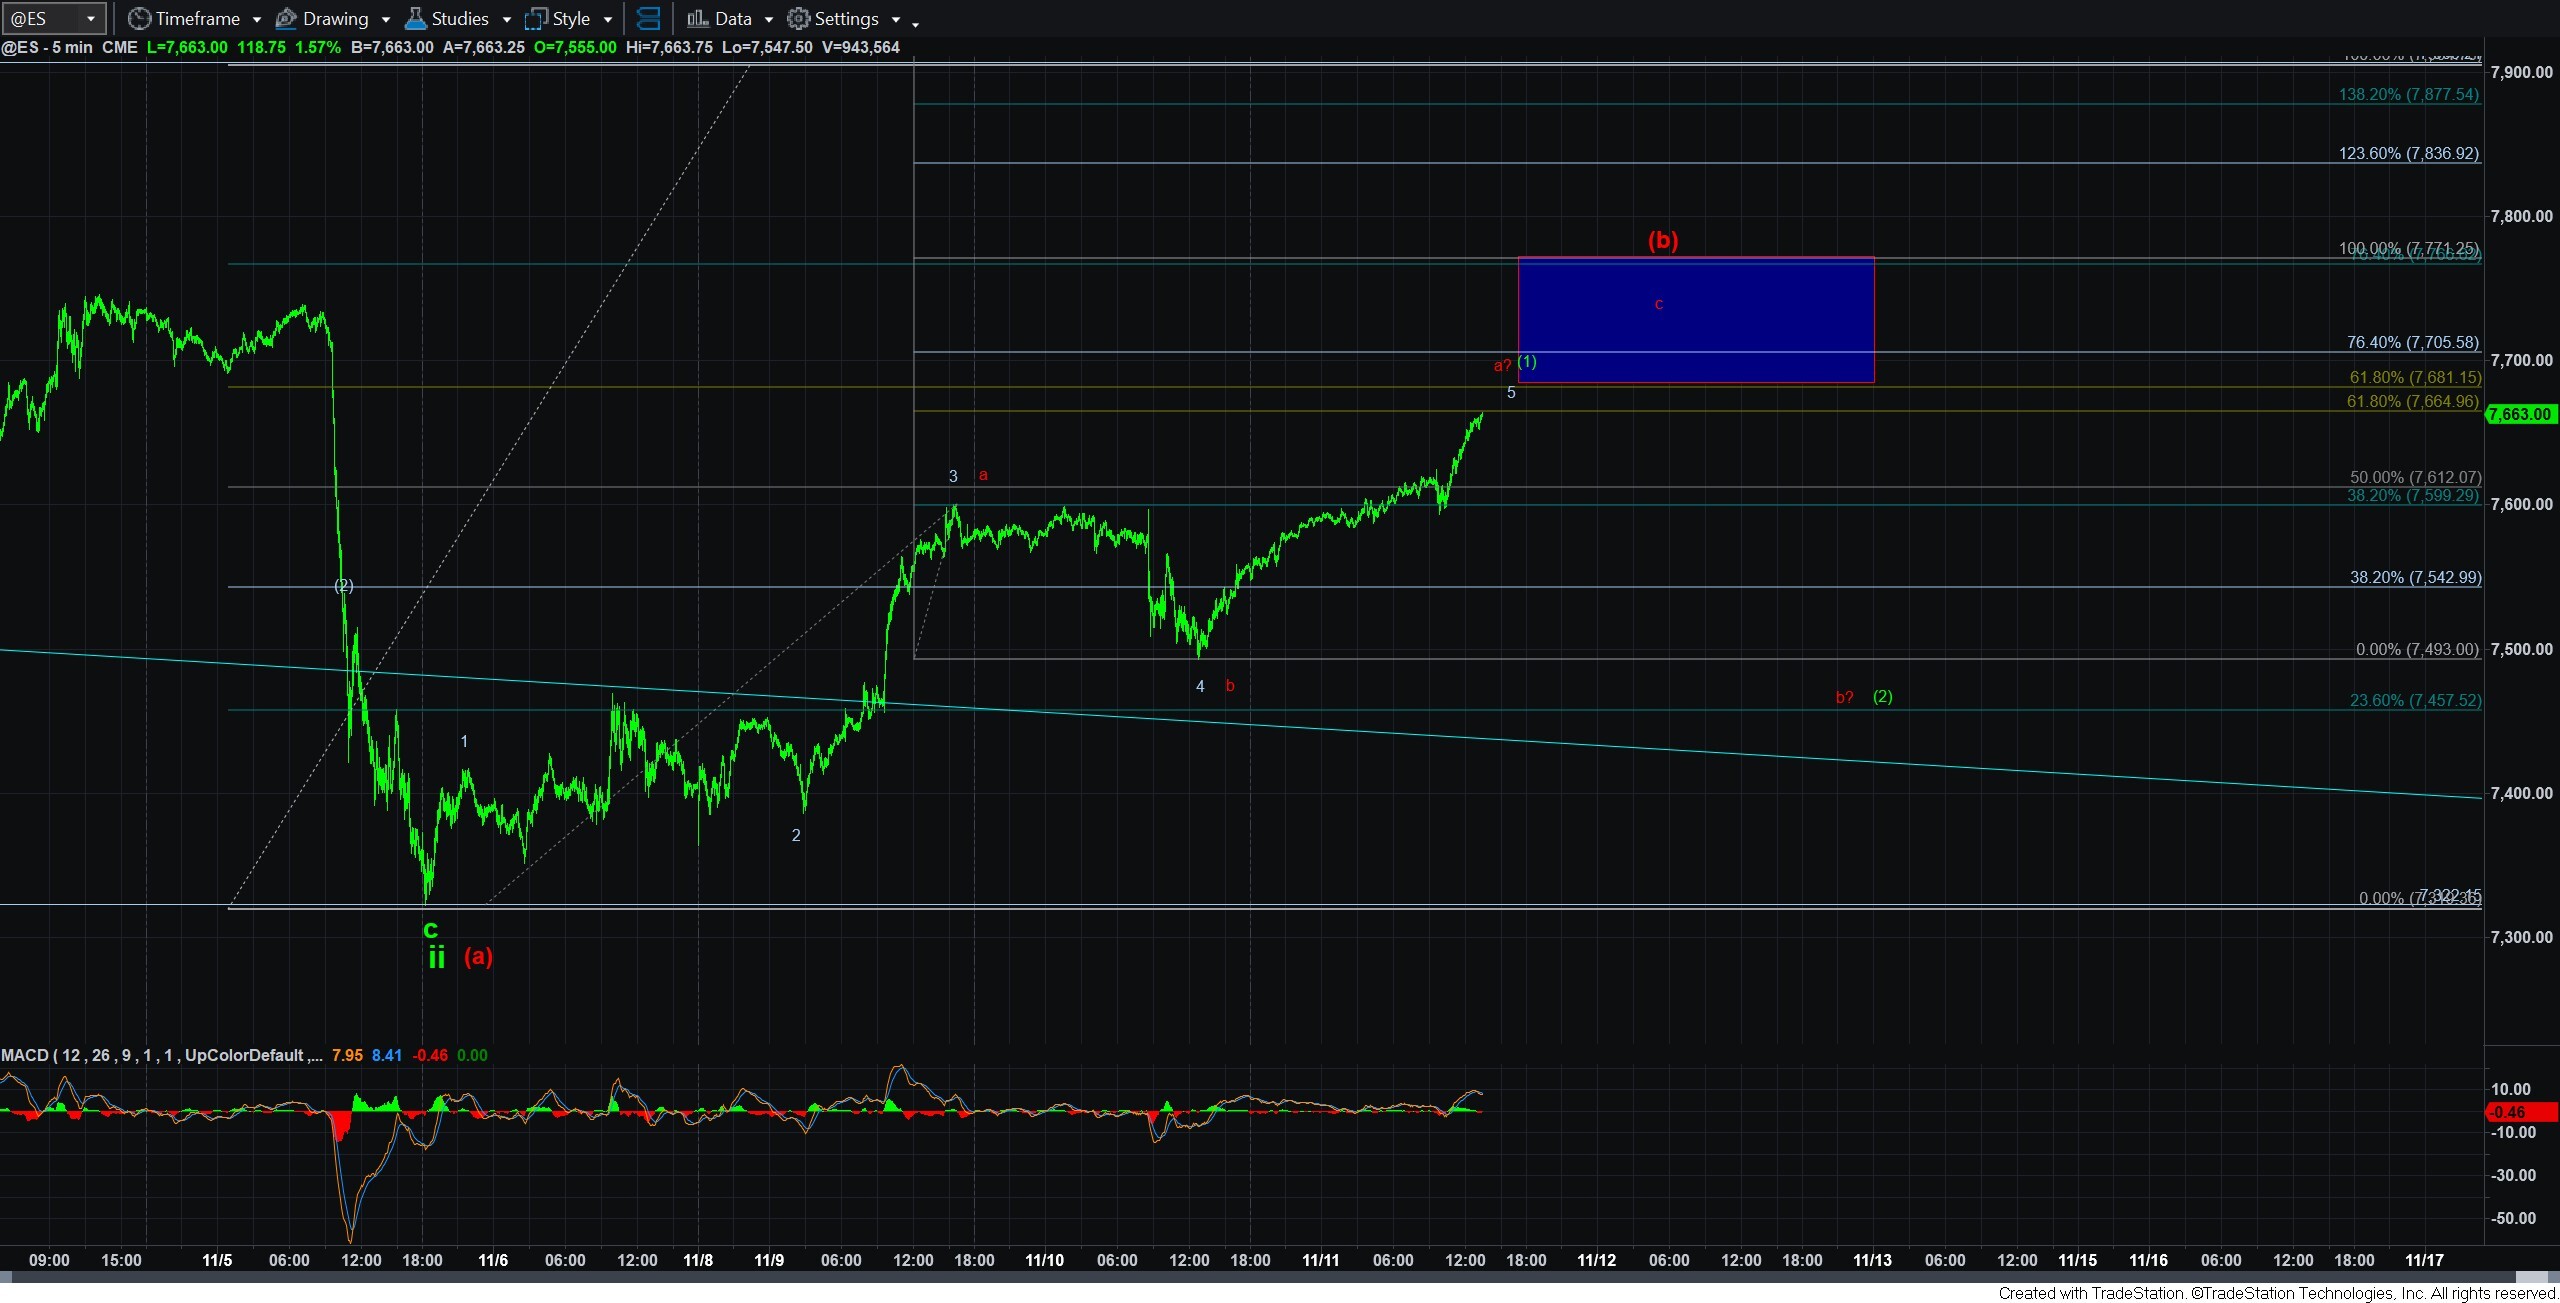
As you can see on the 5 minute charts, this is either the completion of a 5-wave structure for either the a-wave of the (b) wave, or it is the wave (1) in green. That means it is reasonable to expect a pullback imminently.
But, of course, we have some guidance to tell us if we are wrong in this assessment. If you look at the ES chart, you will see that, if this is a 5th wave off the low, then we are approaching the point at which the 5th wave would be .618 the size of waves 1-3. This is usually a nice point for a 5th wave to complete.
However, if it begins to push through that region (7665ES), then it begins to lessen the likelihood that this is indeed a 5th wave. Rather, it would suggest we are already in the c-wave of the (b) wave.
Also, take note that the .618 retracement of the prior decline is just overhead, which is where our resistance box begins. So, that also indicates that risk is rising.
Of course, the market can continue higher into the resistance box in a direct fashion. But, please recognize that the highest probability segment of this rally that we were expecting is just about complete now. In fact, the AI model we created and are trading in the VIX Service based upon Mike and my analysis is up 1.7% since its last long call yesterday, and we would strongly urge those following that to take profits or tighten stops. In fact, this AI program has even exceeded our own expectations at this time. But, also take note that this is not a signal to me that a short trade is to be called for, as I would rather see a clear indication with a 5-wave decline for that potential.
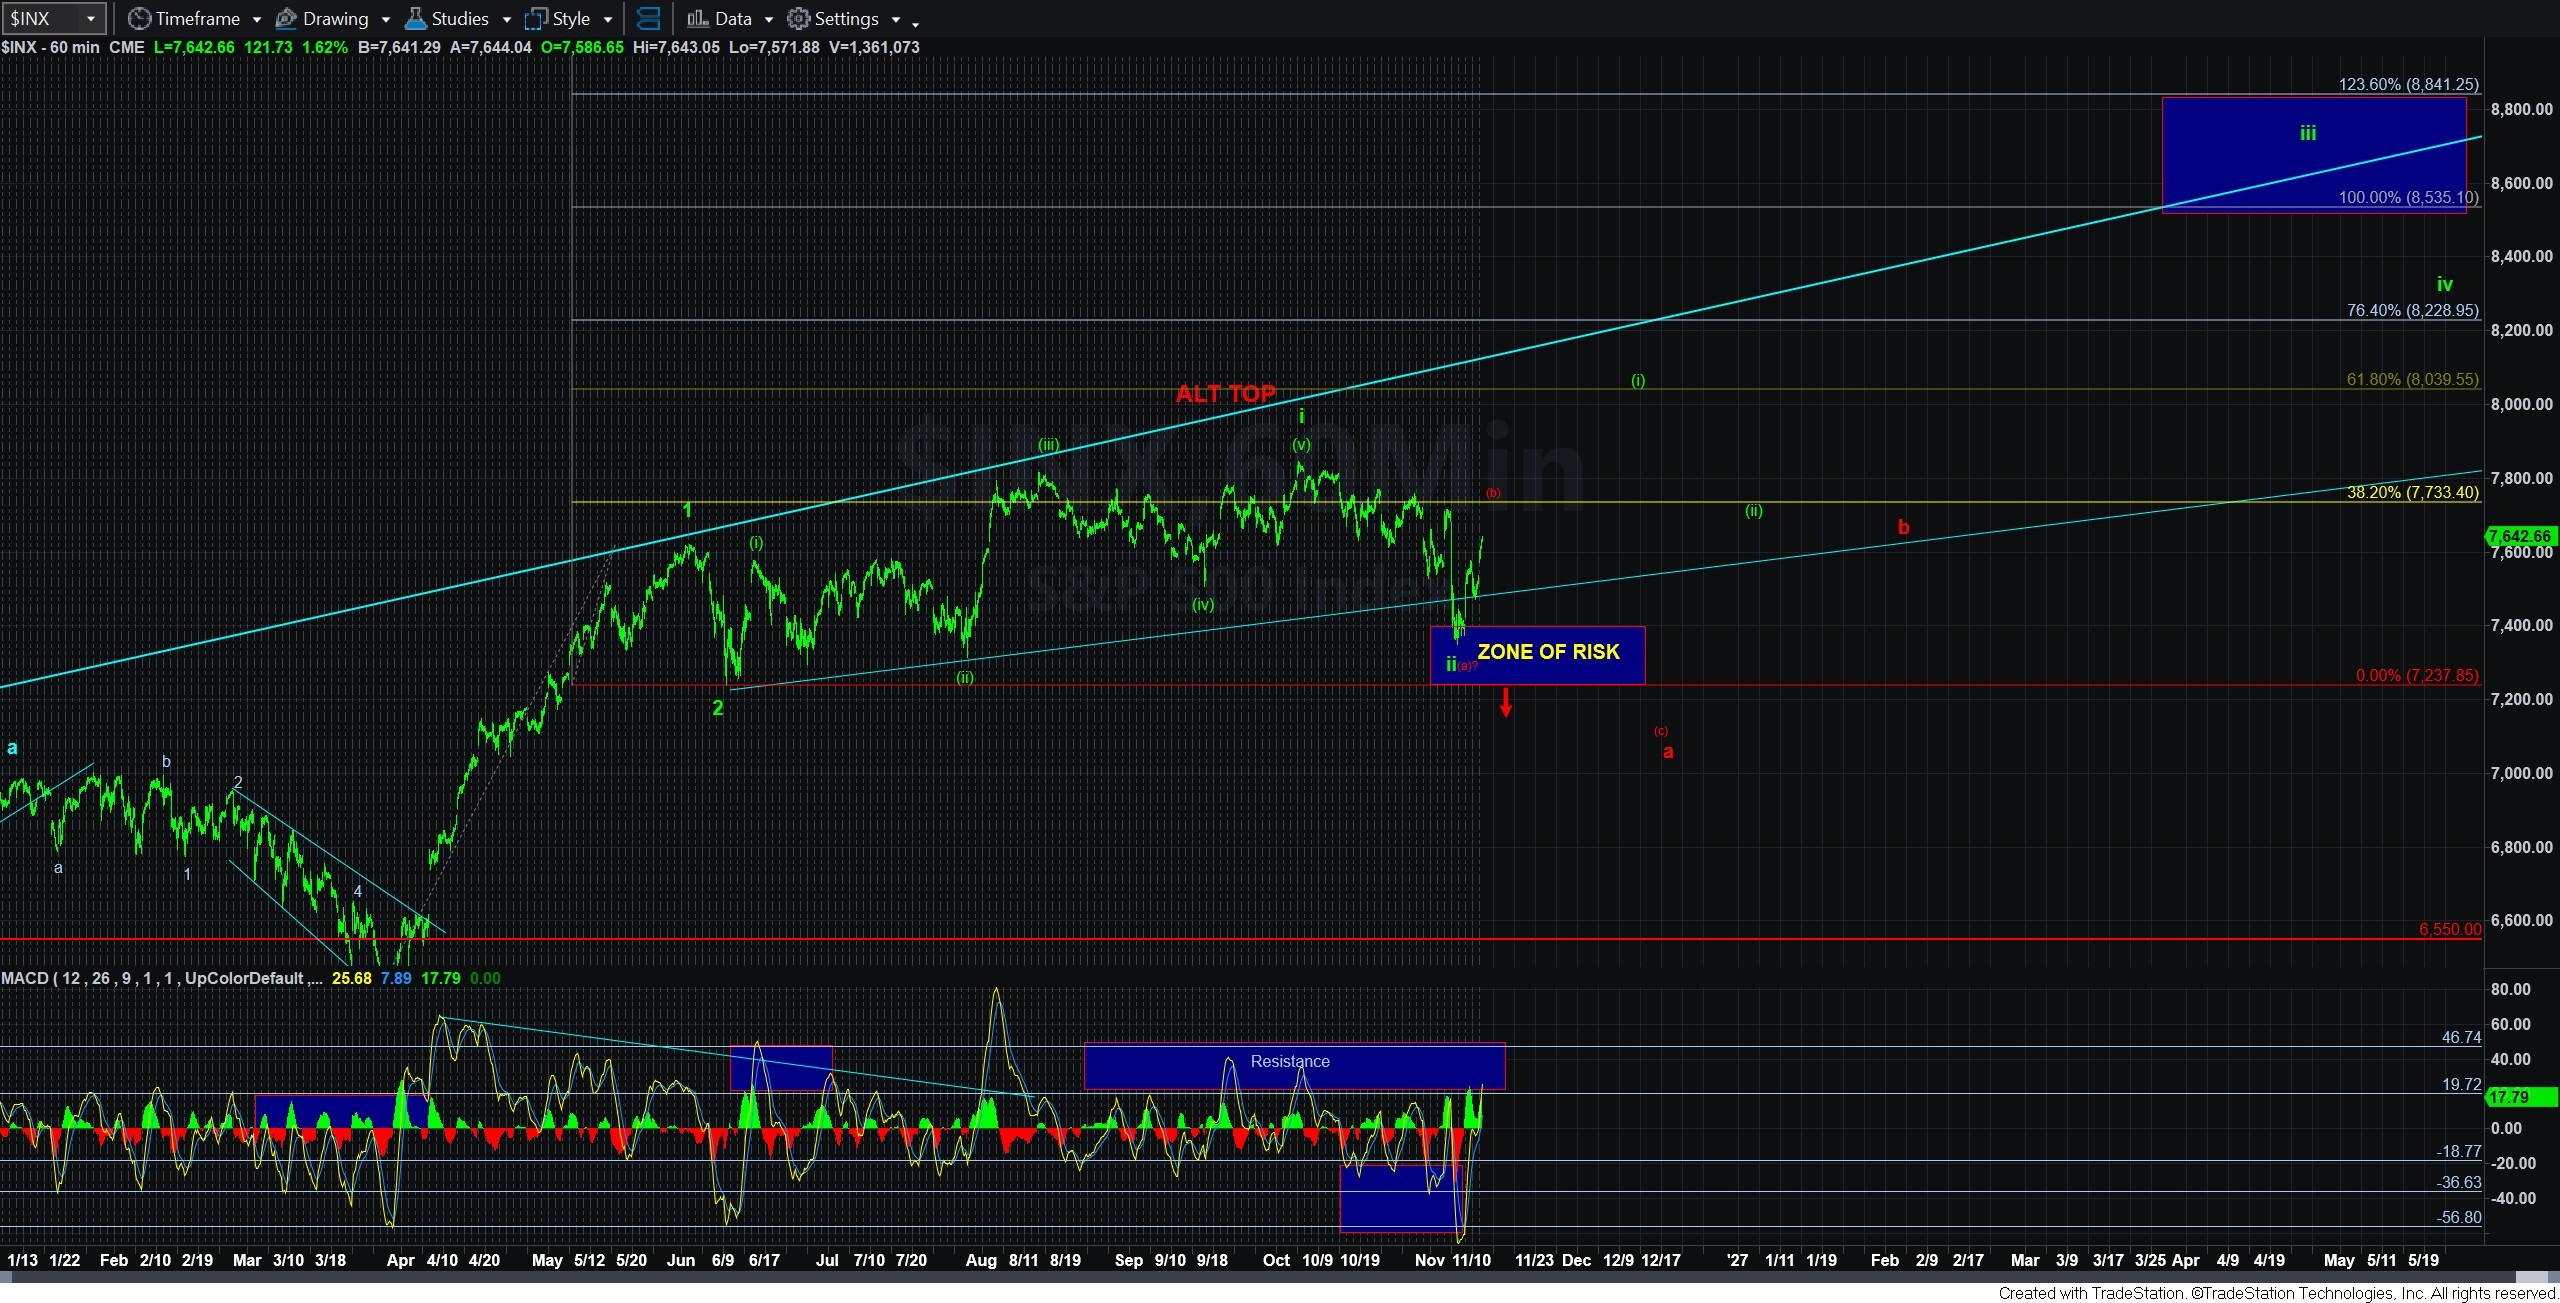
So, as we are approaching the .618 retracement of the prior decline, and the point where we may be seeing the completion of a 5-wave a-wave or green wave (1), risk has risen and a reasonable expectation for a pullback can be maintained. While that does not necessarily mean that a pullback will be seen, should the market push higher in a more direct manner and suggest it is in the c-wave of (b) already, it also suggests that risk has risen with this rally to our resistance box. But, also take note that the MACD on the 60-minute chart has now reset with a move back to the resistance region again.
Furthermore, the nature of the next decline will be quite instructive as to how we move forward. If we top imminently in either the a-wave or wave (1) in green, then we should see a corrective pullback over the coming days. However, if we see a clearly impulsive decline at any point in time from now, then we will have to assume that the red (b) wave has completed at our target/resistance zone, and the (c) wave decline has likely begun. For now, I am going to expect a corrective pullback should we top imminently.
Lastly, I want to stress again that we are forced to track the green count despite how ugly the initial move off the low was and despite how deep the last decline took us. We have no break of that green pattern as of yet, and it is prudent to track this potential until the market completely invalidates it or at least gives us a strong indication it is setting up to invalidate it.