Reversal Seen – But, May Not Be What It Seems
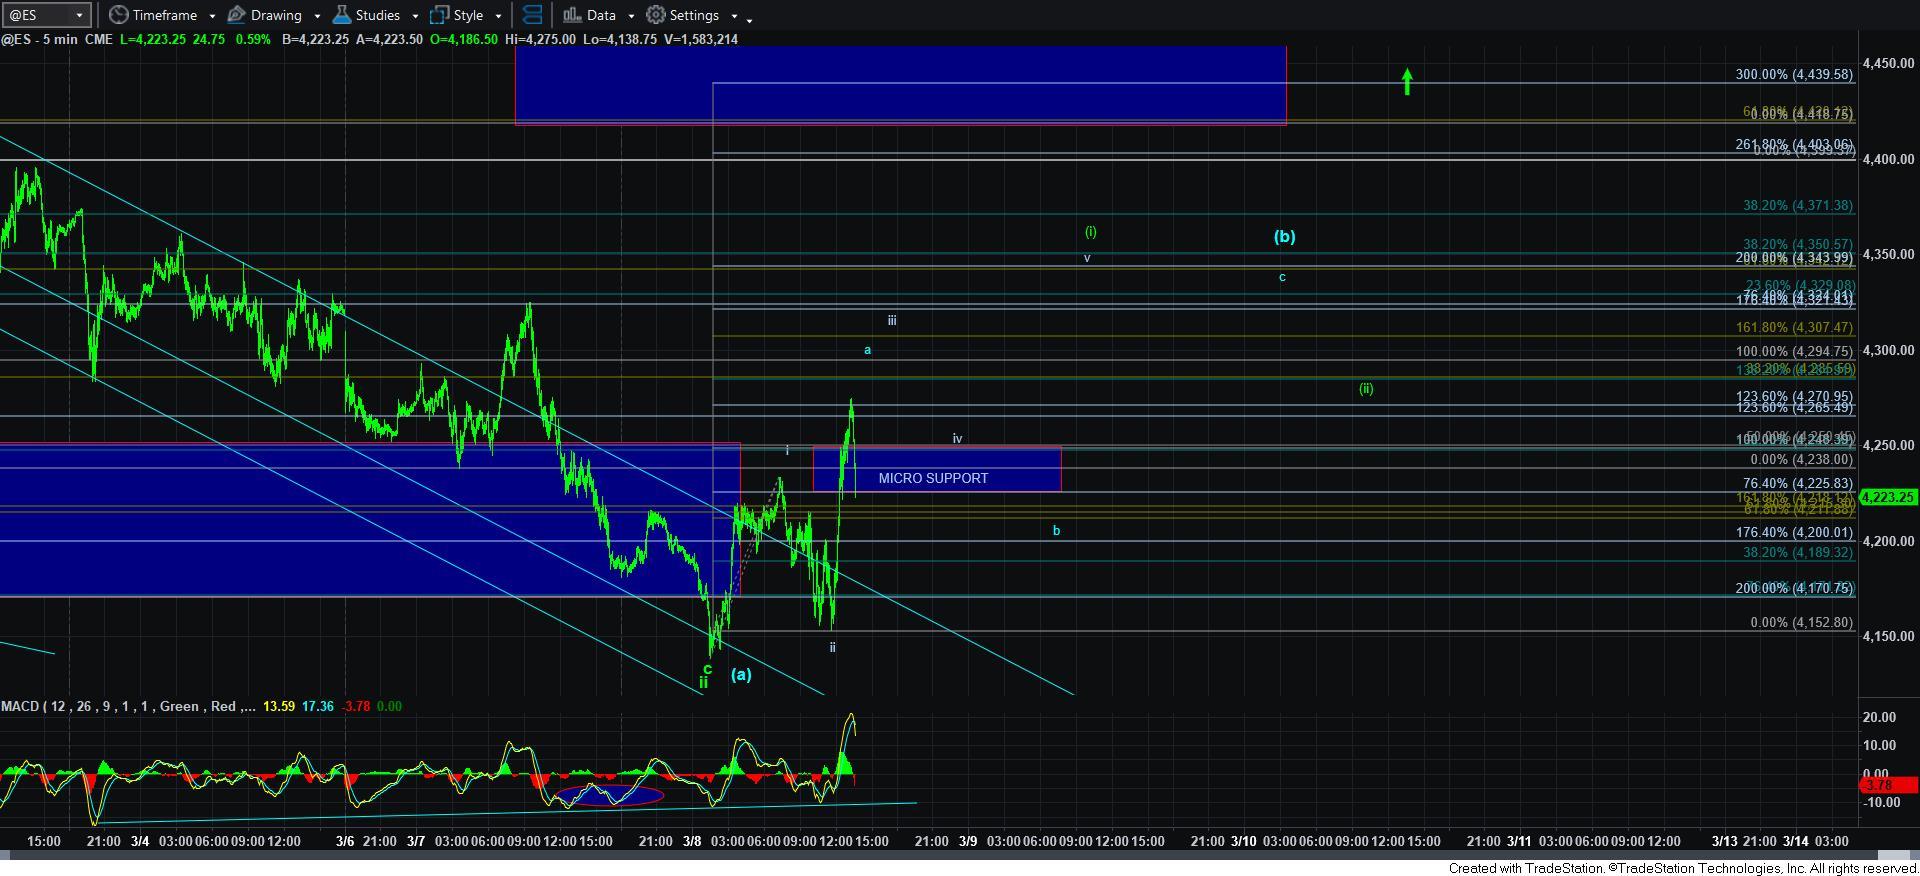
While the market certainly dropped a bit below the ideal support for a wave ii, we still did see a reversal today. However, in order for this reversal to have any meaning, we need to complete 5-waves up off the lows. And, I have outlined that “ideal” 5-waves up in the ES chart attached.
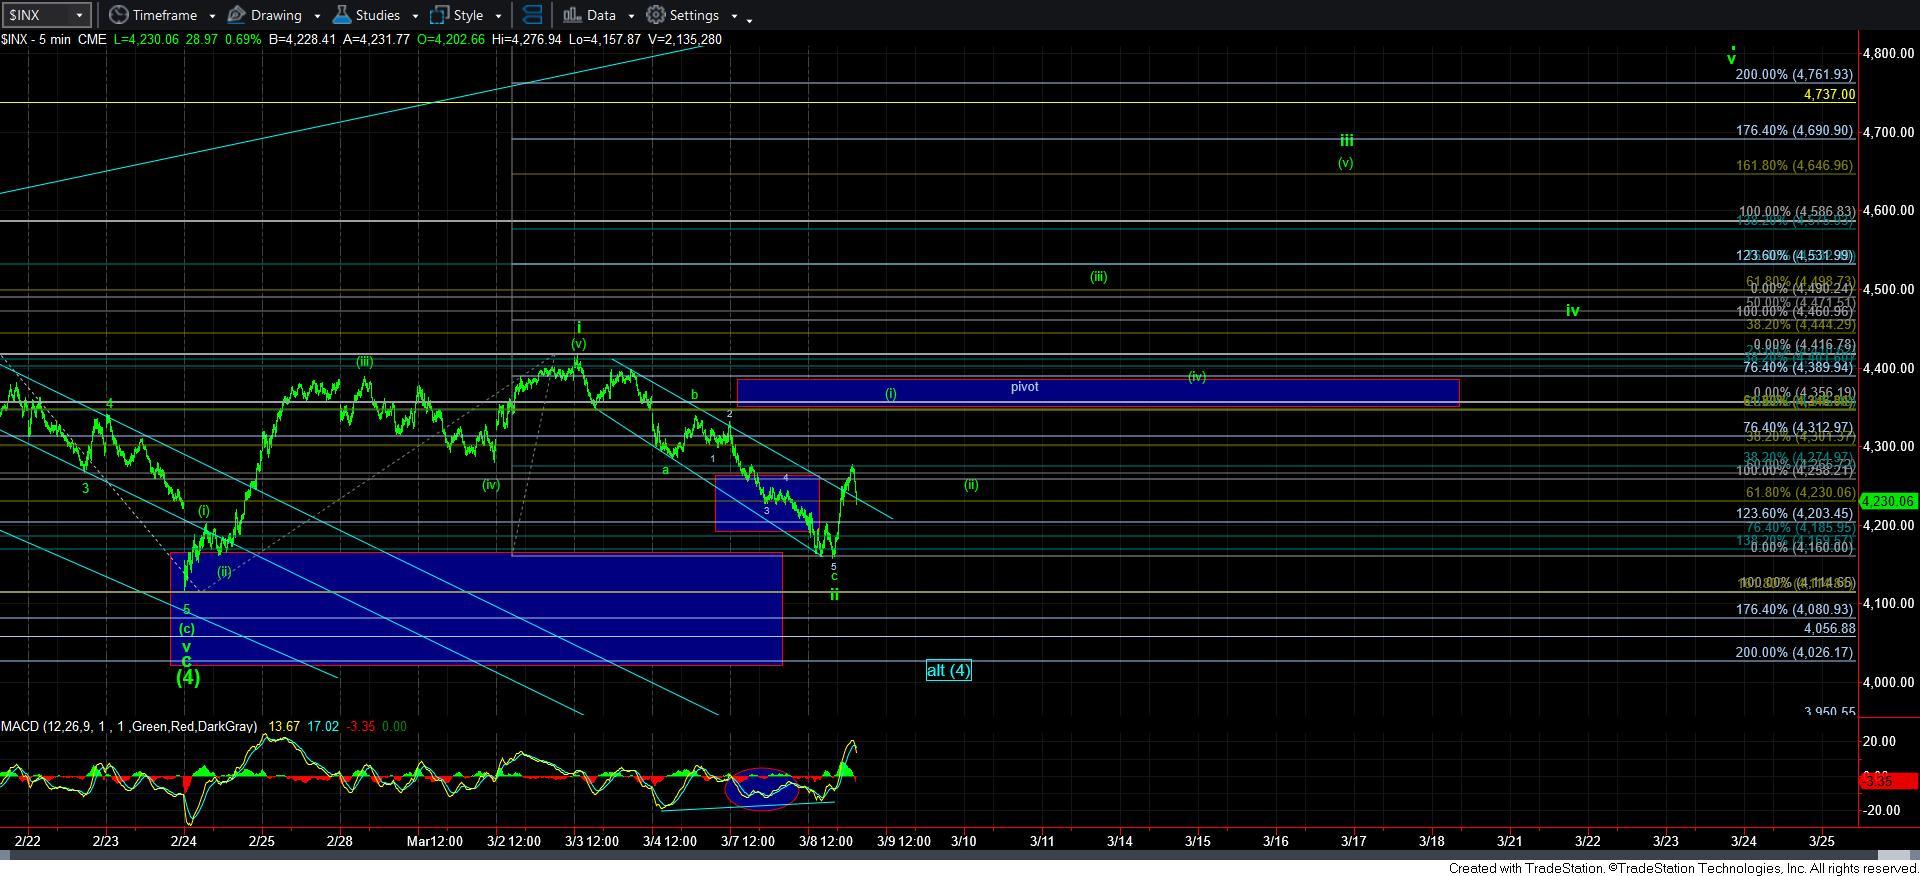
The problem I am still having is that the ES and SPX are presenting two different ways. So, we are going to be feeling around a bit until they re-align.
For now, I am trying to track 5-waves up off the overnight low in ES, whereas an argument can be made that SPX has completed one off today’s low.
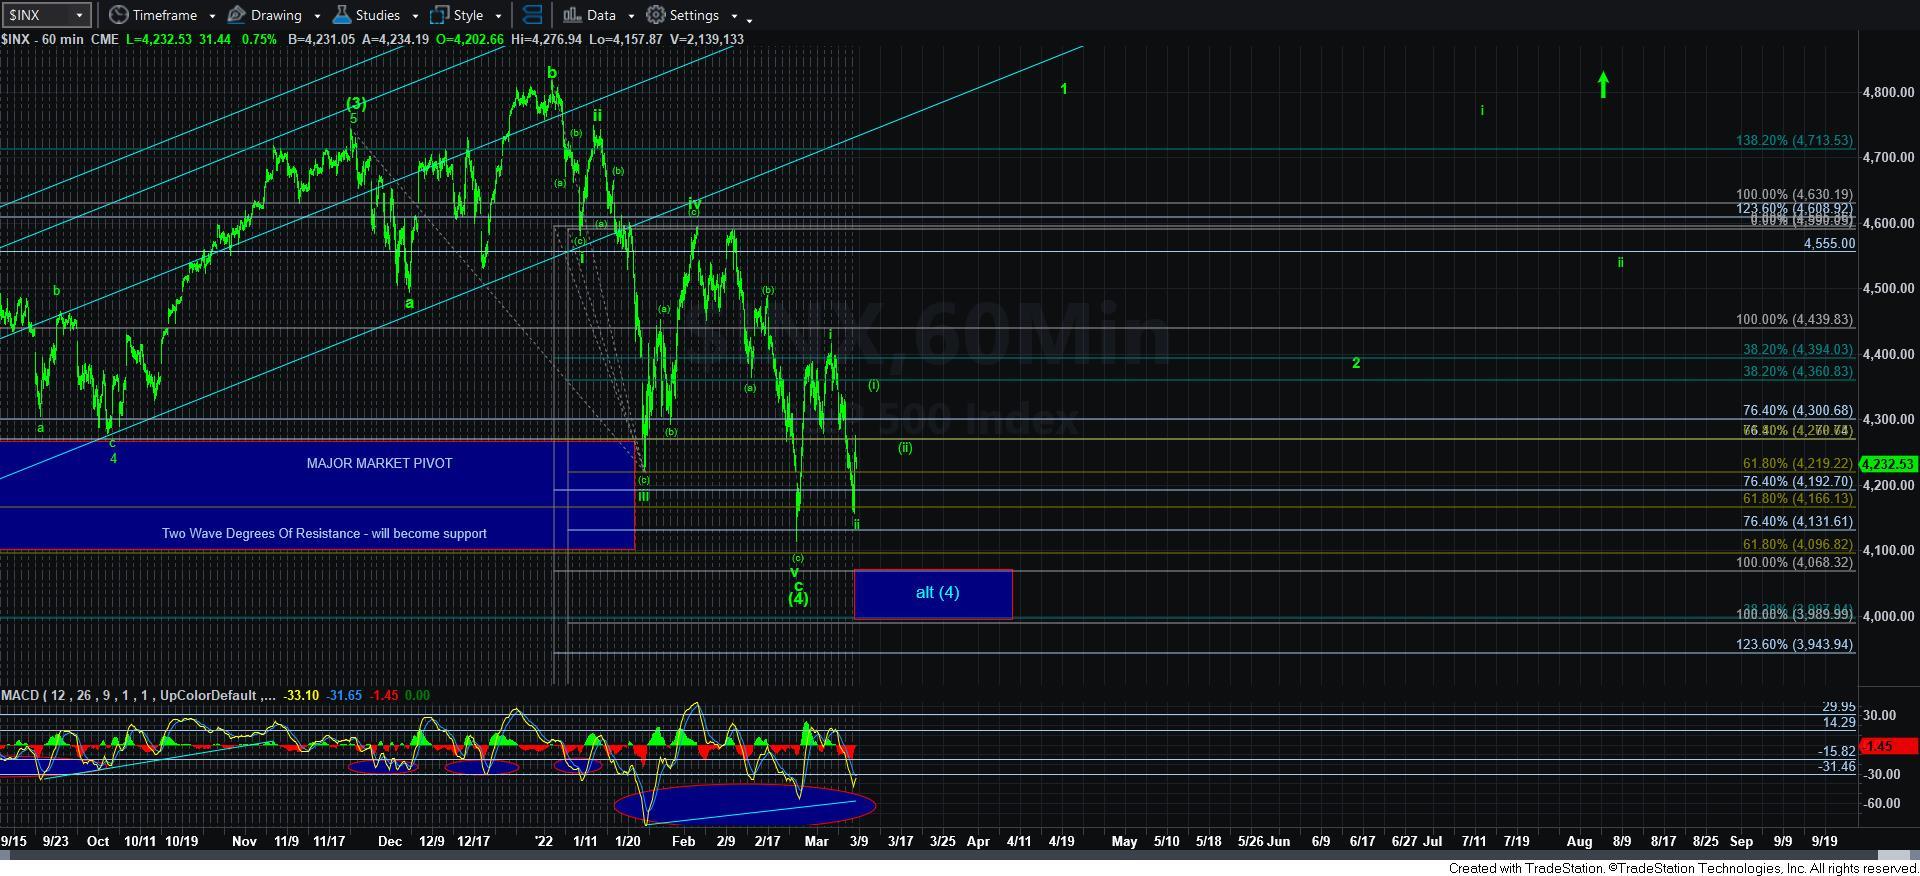
The issue with the ES chart is that if we break below the outlined support box before we complete 5-waves up, it is entirely within the realm of probabilities that we are simply developing a [b] wave (shown in blue) within a 5th wave that is pointing down to a lower low in the alt [4] count. Remember, if we are going to a lower low, it likely means we get an [a][b][c] structure to a lower low because the move down in the c-wave of wave [4] is likely an ending diagonal.
So, for now, we need to watch how the market handles the current region. We are not out of the woods yet. A break below the support can point us directly down to lower lows, or we can see more of an a-b-c within a bigger [b], which I would much prefer, and which is outlined on the 5-minute ES chart.
I wanted to get this update out to you as soon as possible since the market is still quite treacherous at this moment.
However, you look at the current region, I want to remind you that our ideal upside target for wave [4] is still the 5500SPX region. So, consider your risk/reward when you review your charts and plan.