Revenge Of The b-Wave?
With the break below 2572SPX today, the market has provided us indications that the wave iv pullback may not yet be complete. But, that does not mean the market is being kind to the bears.
First, I want to take a moment to explain why the standard impulsive structure to the upside has likely been broken. This is based upon our Fibonacci Pinball structure of Elliott Wave.
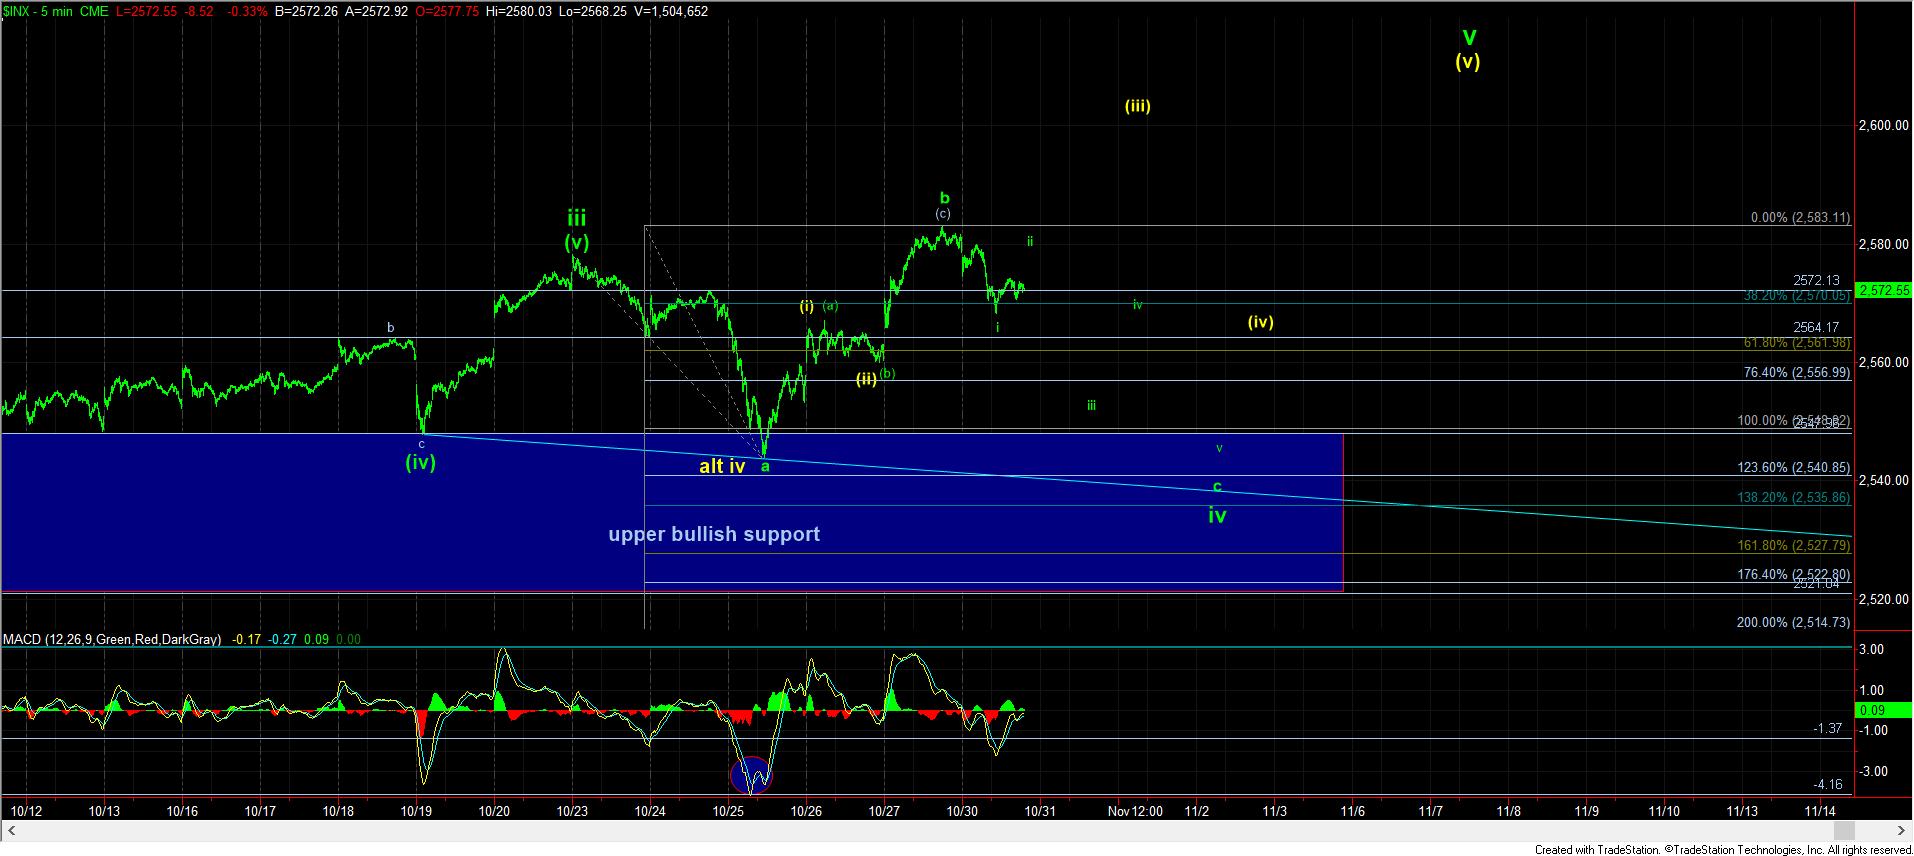
Once we see a wave (i)(ii) structure off a low, we normally see wave iii of (iii) targeting the 1.00 to 1.236 extension. In our case, we came right up to the 1.00 extension at 2583SPX. Now, in a bullish pattern, the market “should” not break back below the .618 extension for wave iv of (iii) if it is going to remain strongly bullish and continue up towards the 1.382-1.618 extension to complete wave v of (iii).
Since we broke down below that region today, it suggests that, the great majority of the time, the market is not going to continue to the upside. Rather, it suggests that all we had was an (a)(b)(c) rally into the 1.00 extension, wherein (a)=(c) in a corrective rally, which I have now labeled as the b-wave high. And, yes, b-waves can make a higher high, especially in very bullish markets.
Now, the reason the market is not being kind to the bears is that, most of the time, we would see a 5 wave impulsive structure for wave i of the c-wave down. Today, the market only provided us with 3 waves down. So, either the market has provided us with a i-ii, 1-2 downside structure, which means we are about to drop strongly, or, we are setting up the c-wave down as an ending diagonal, which will be overlapping and provide a lot of whipsaw on the way down. So, it has not provided the bears an ideal, low-risk set up with a standard and clear i-ii downside structure to attempt a short trade. This is the reason that I noted above that the market is not being kind to the bears, even if we follow through to the downside.
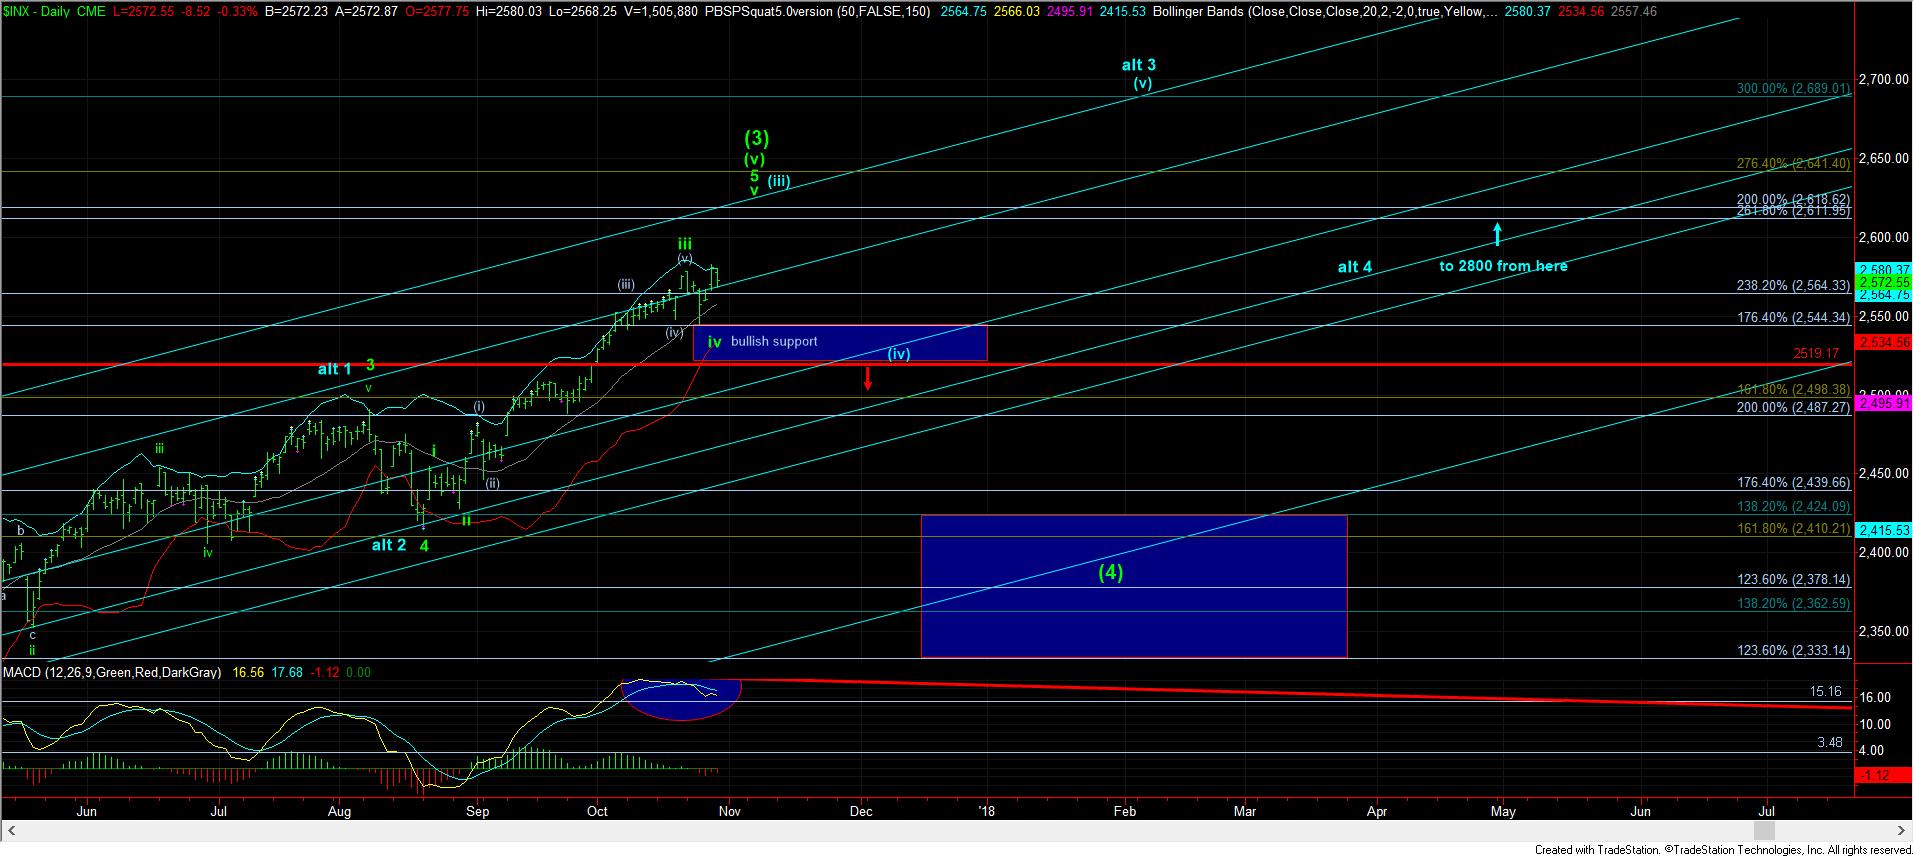
Moreover, since all we had is 3 waves down off the highs, it also leaves the door open that the market wants to continue higher in an ending diagonal to the upside, which is not a standard impulsive structure consisting of 5 wave sub-structures, but is comprised of 3 wave overlapping structures on its way up. And, since this is still a strong bull market, clearly one has to keep this potential in the back of their minds, which is why I have now placed this on the chart as the alternative count in yellow.
You see, in order to trade more confidently, we always look for 5 wave structures to trade, as that provides us with the highest probability structures to trade confidently, and they also provide strong indications as to when they invalidate, especially as compared to overlapping diagonals, which have a much more variable structure.
So, as long as we remain below the 2583SPX high, I am going to be viewing the primary count as having started a c-wave down. Moreover, the minimal target for this c-wave is where a=c at 2548, with 2535 being the point where c=1.382*a, and 2527SPX being where c=1.618*a.
Again, I want to caution people from aggressively shorting this market, since there is no “high probability” structure suggesting we are in a c-wave down. Rather, I see the potential for the c-wave down as simply being more likely, especially as we remain below the 2583SPX region.
But, please continue to focus on the potential that this upside structure off the August lows has not likely completed, as it still seems to need a move over the 2600SPX region before we can count a completed 5 waves off the August lows. So, again, aggressive shorting is still not advised.