Resistance Held So Far
As we expected another push higher today, I did not quite expect we would test our Main Resistance region as we did today. Although we did get a spike and reversal at the high a point over the resistance region, the market has not signaled yet that it is going to turn down in a meaningful way.
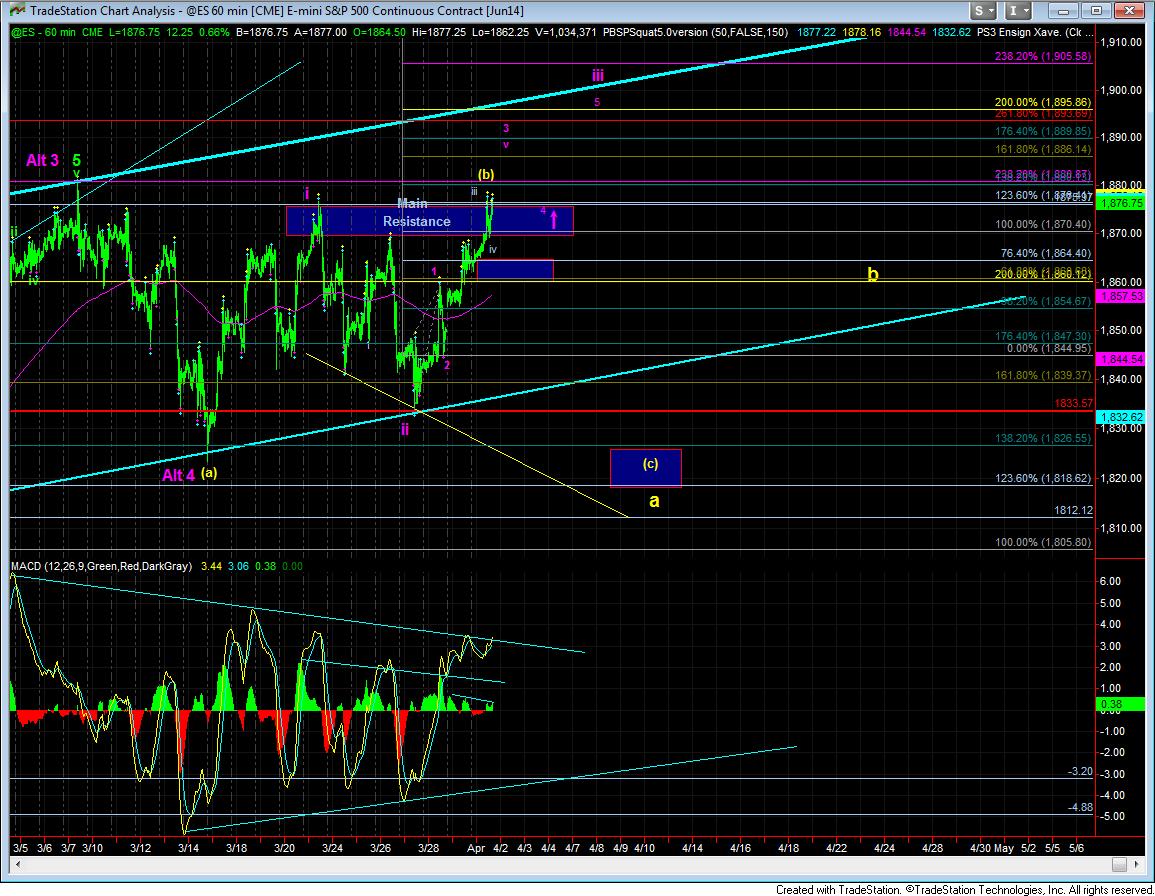
What the spike up did do was invalidate the prior yellow count, and has left us with a potentially larger yellow (b) wave. In fact, the 1880ES level is where the c-wave of the yellow (b) would be equal to 1.382 times the size of the a-wave. But, if the market is able to move through that level, then it would be potentially more bullish on an immediate term basis. But, I want confirmation with the wave 4 of purple wave iii holding support over the prior Main Resistance region on a back test of that region to maintain a bullish stance. Otherwise, it would just be a bigger (b) wave high.
What I also have to note is that the purple count, as it is now represented is a very unusual and unreliable count. The wave i of that count truly counts best as 3 waves, and the wave 1 of purple iii, as it is represented on this chart, would have to be counted as a leading diagonal with an extended 5th wave, which is a pattern I have seen so rarely I can count the number of times on my hand. So, again, I am unable to rely upon such pattern from a bullish standpoint, until it is able to break out further and successfully re-test this resistance region from above on a pullback.
As for support, as long as the market can maintain over the .764 extension in this “bullish” count, which is 1864ES, then I have no choice but to look higher. However, a break down below 1864ES in an impulsive manner will have me looking again to a (c) wave target still in the lower 1800ES region.