Resistance Held – For Now
Despite the market pushing strongly against upper resistance, we finally were able to turn down today towards our wave 2 target box. So, the question is if we can actually drop down into that box over the coming days?
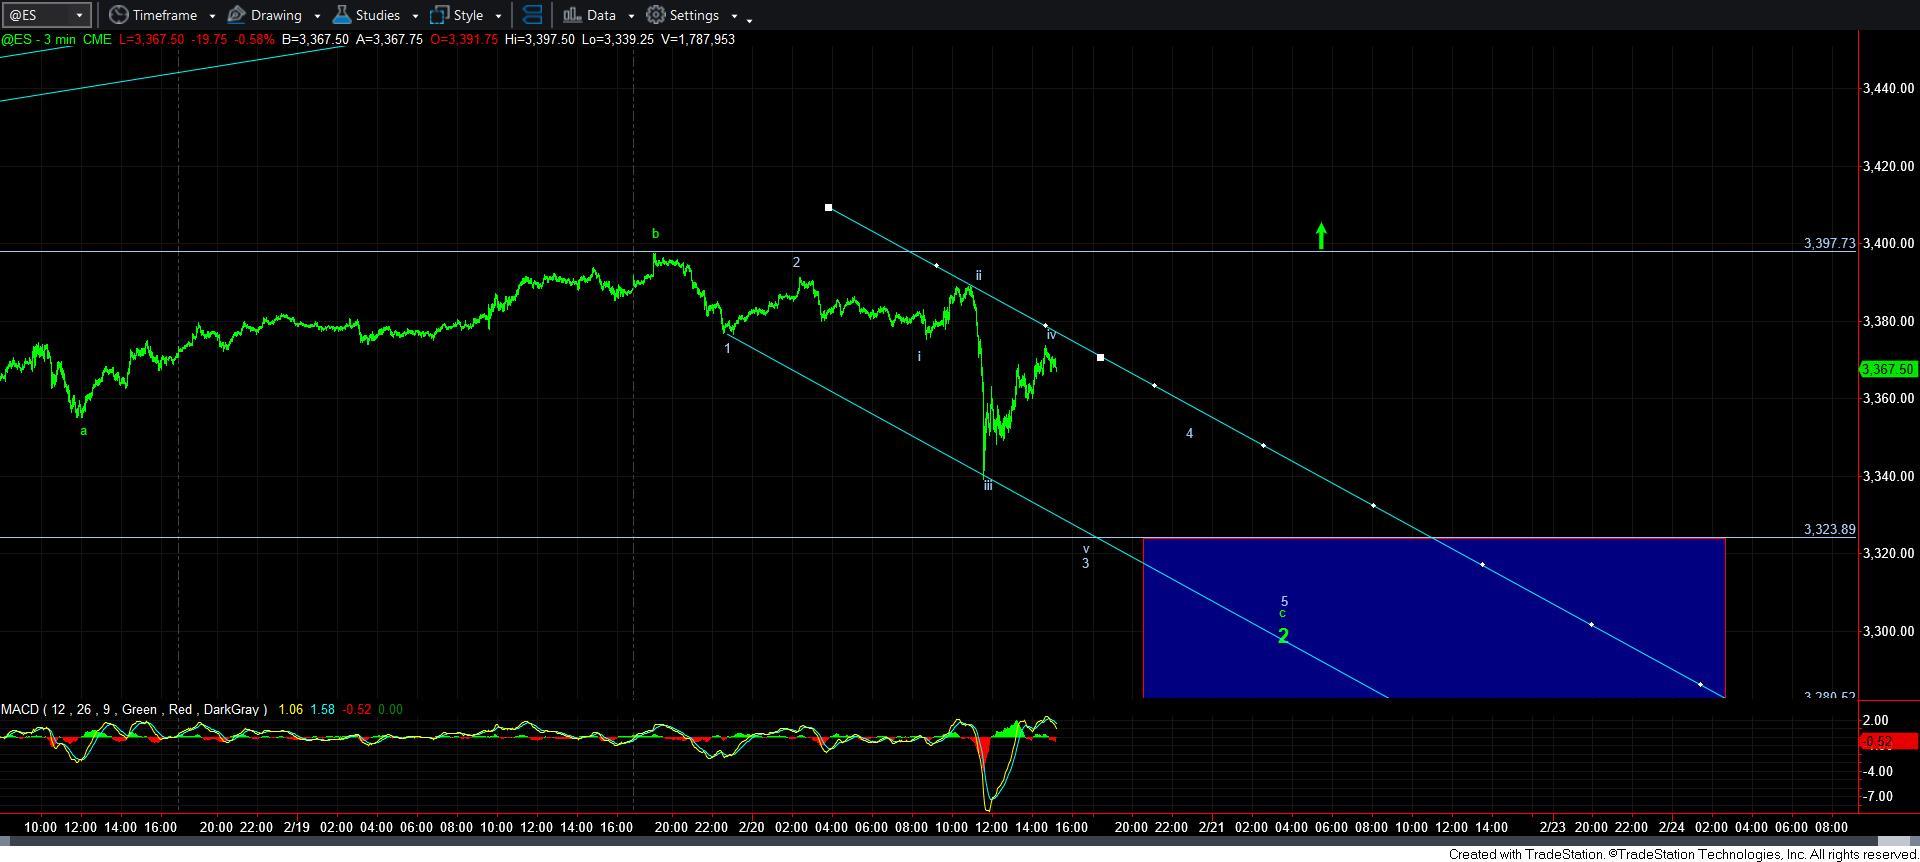
As we started the day today, I noted that as long as we hold below 3293ES, pressure will remain down. And, just after 10AM, as the market was hovering in the 3388/3389ES region, I noted that “IF the market has any intention of turning down, this is where it should happen.” As we now know, the market did finally turn down, and came within a stones throw of our support box for wave 2.
Normally, we see an a-b-c structure for wave 2, wherein the c-wave provides us with a 5-wave downside structure. Whereas the ES/futures have more waves taken shape in the overnight action, we clearly do not have enough waves in place to substantiate a 5-wave c-wave down. Of course, during the past year, we have seen several pullbacks take shape as irregular structures, and this may be yet another. However, we will need to get back over the 3388ES region to suggest this could be the case again.
In the meantime, I have outlined what 5-waves down would look like in the ES. Yet, due to how high we have come up off today’s low, it does place strong questions in my mind as to whether all 5-waves will play out as shown.
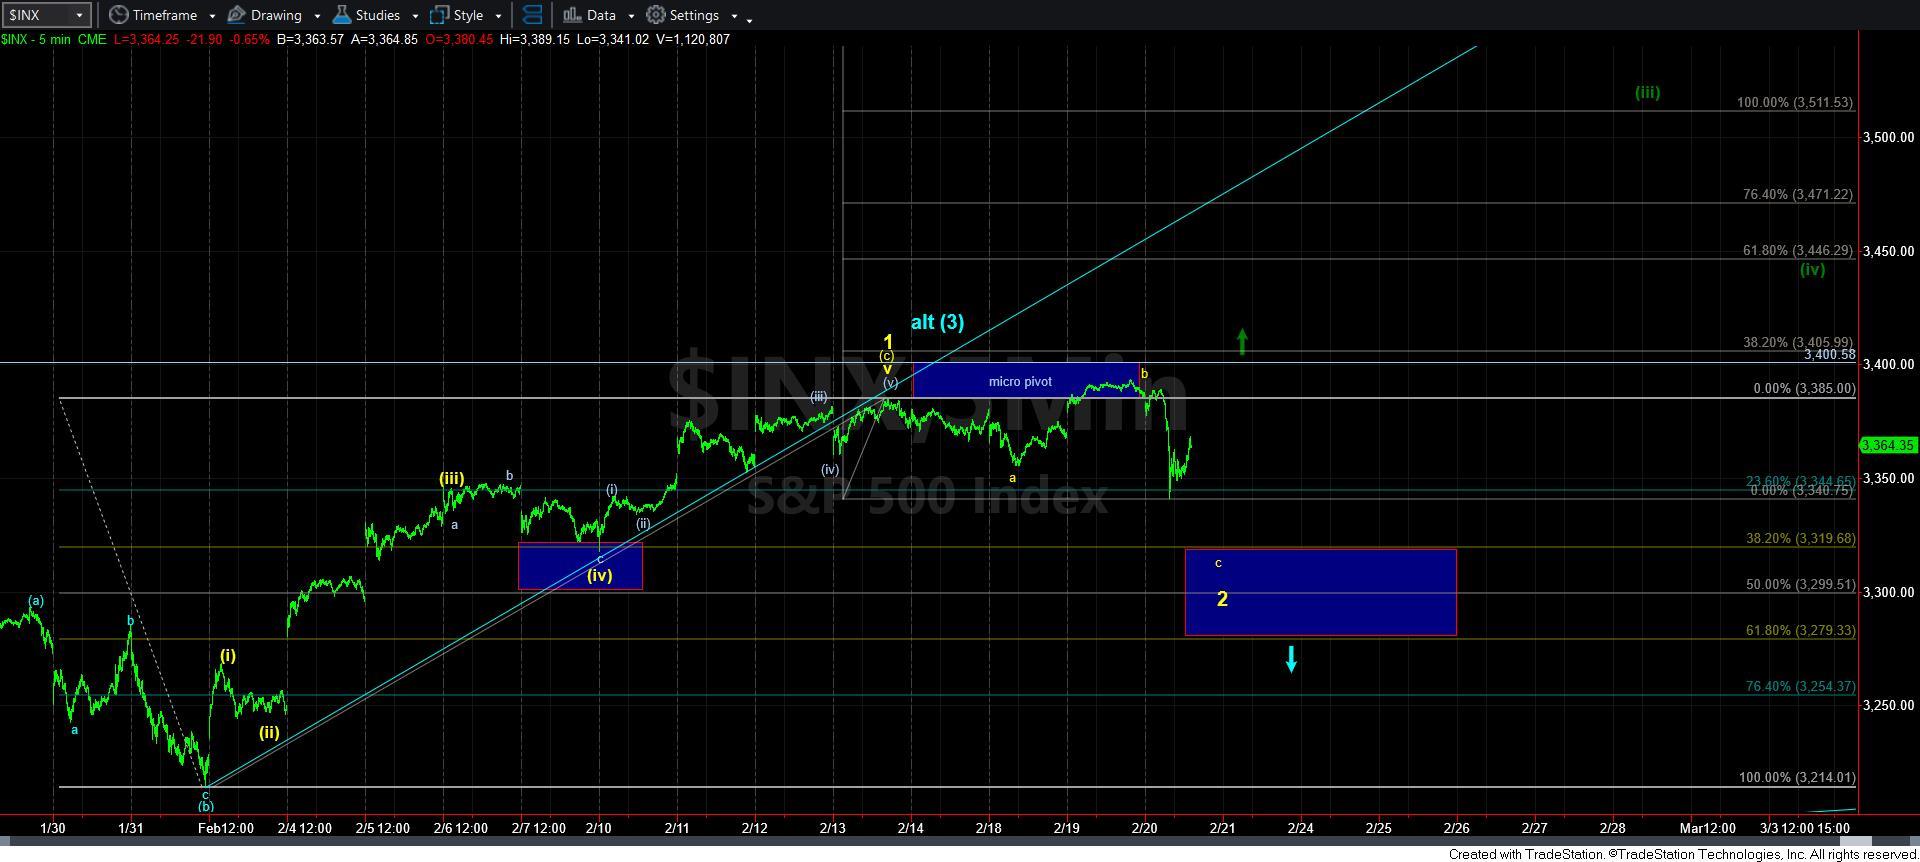
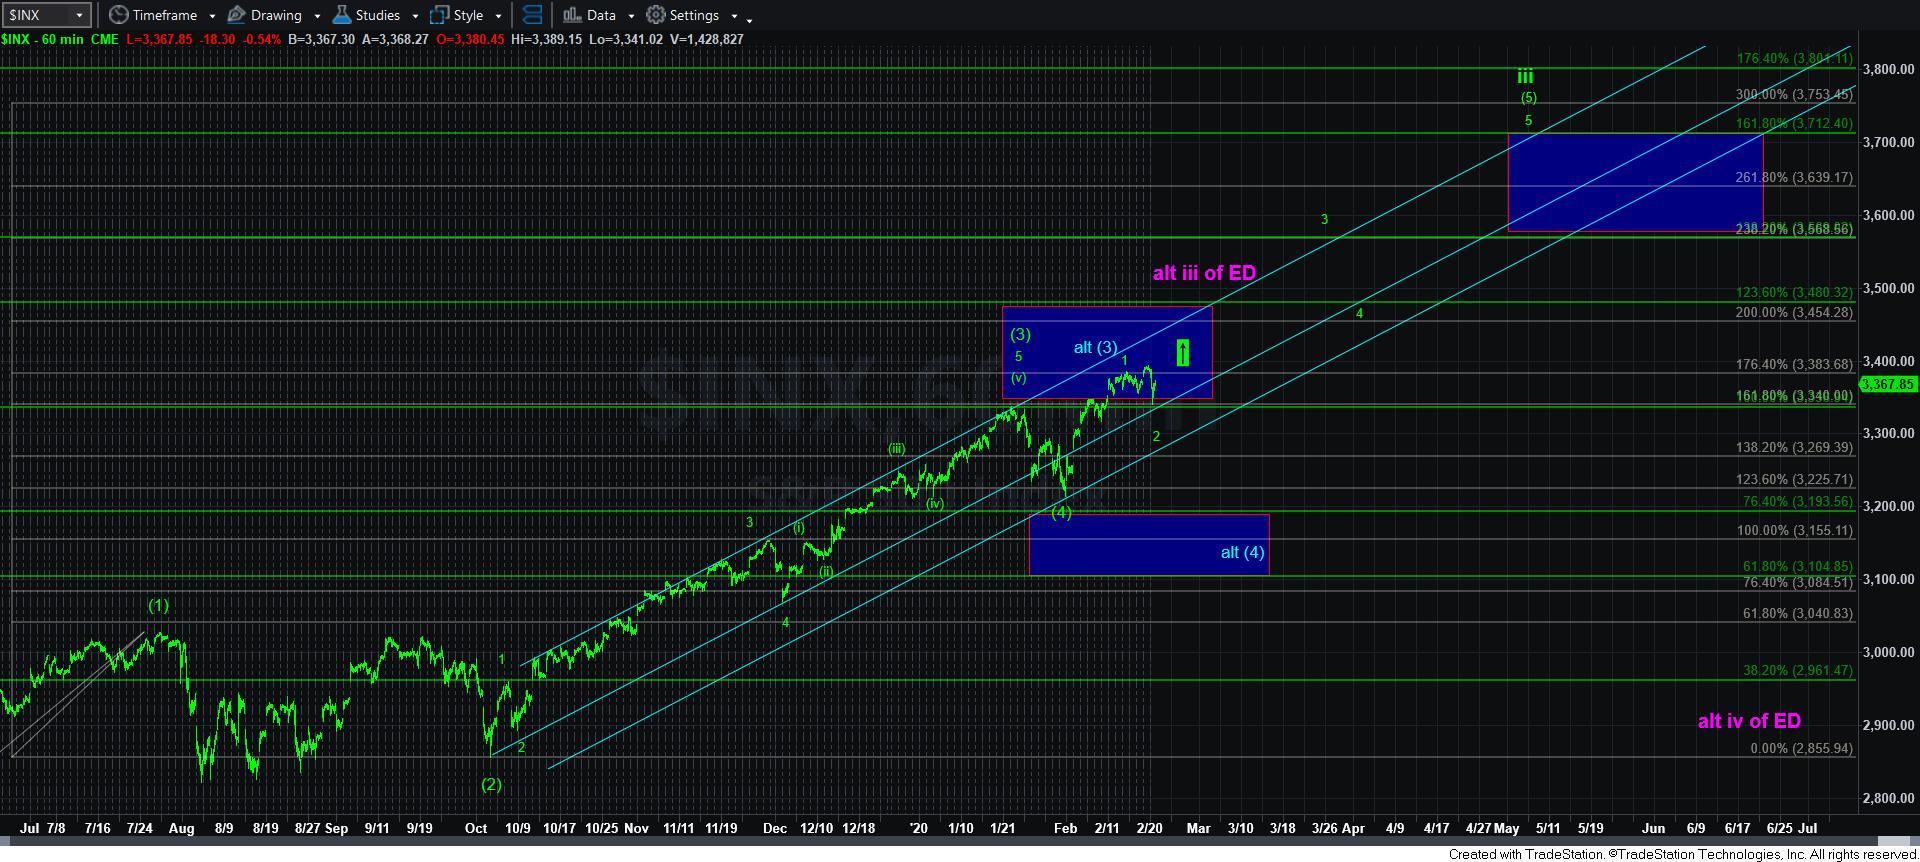
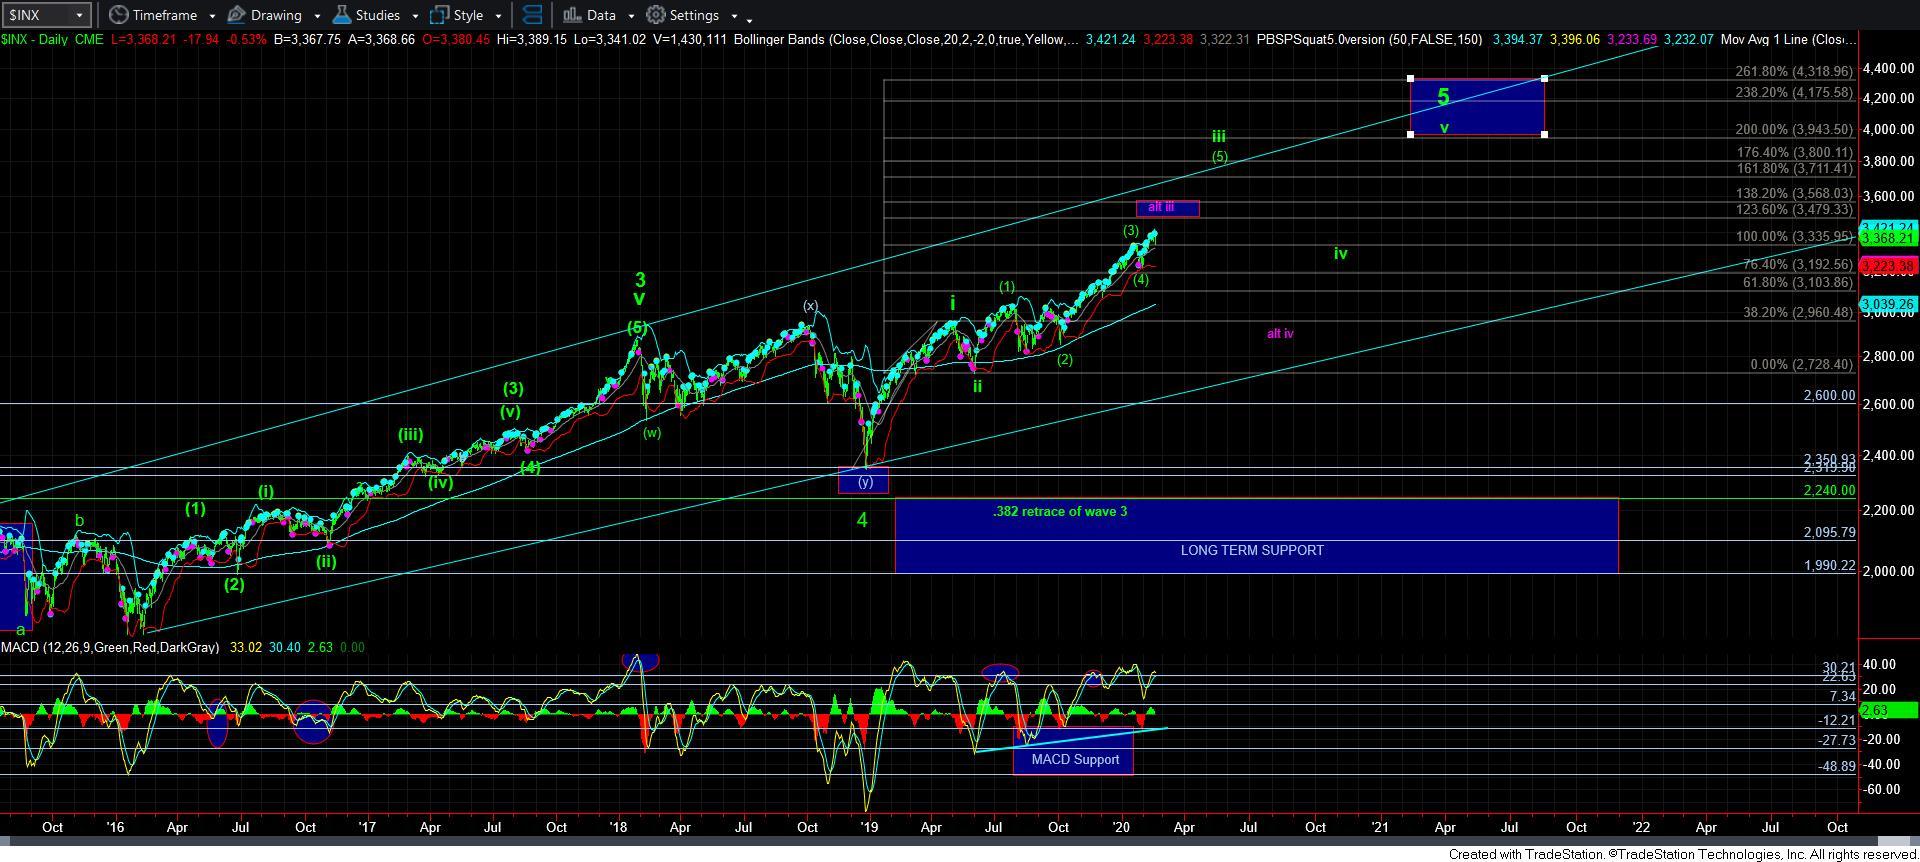
So, I think the better focus should be on our support and resistance. As long as the market remains over 3280, especially if we are able to drop again in the coming day or so, then all we are doing is filling in our wave 2 pullback. And, the next time we break out over 3400SPX, we should be well on our way to an initial test of the 3480SPX region, with potential for a continuation pattern to 3711SPX, which is our ideal target for wave [5] of iii, as you can see on the 60-minute chart. (Please take note that the yellow count on the SPX is now a full-fledged green count, which now matches the daily chart).
Since the count has become clearer that wave 2 had not yet ended last week, then my alternative count now is presented in blue. That would suggest that the recent high was actually a more extended wave [3] of iii, and a break down below 3280 will likely be pointing us towards the 3155-3192SPX region for alt [4] in blue, as shown on the 60-minute chart.
Also, take note that if the ending diagonal is going to play out (purple), it makes it much more likely to do so once we strike the 3480SPX region, as I explained yesterday in our live video. So, that would suggest that both alternatives I am now tracking, along with the primary count, suggest that the 3480SPX region will likely be struck.
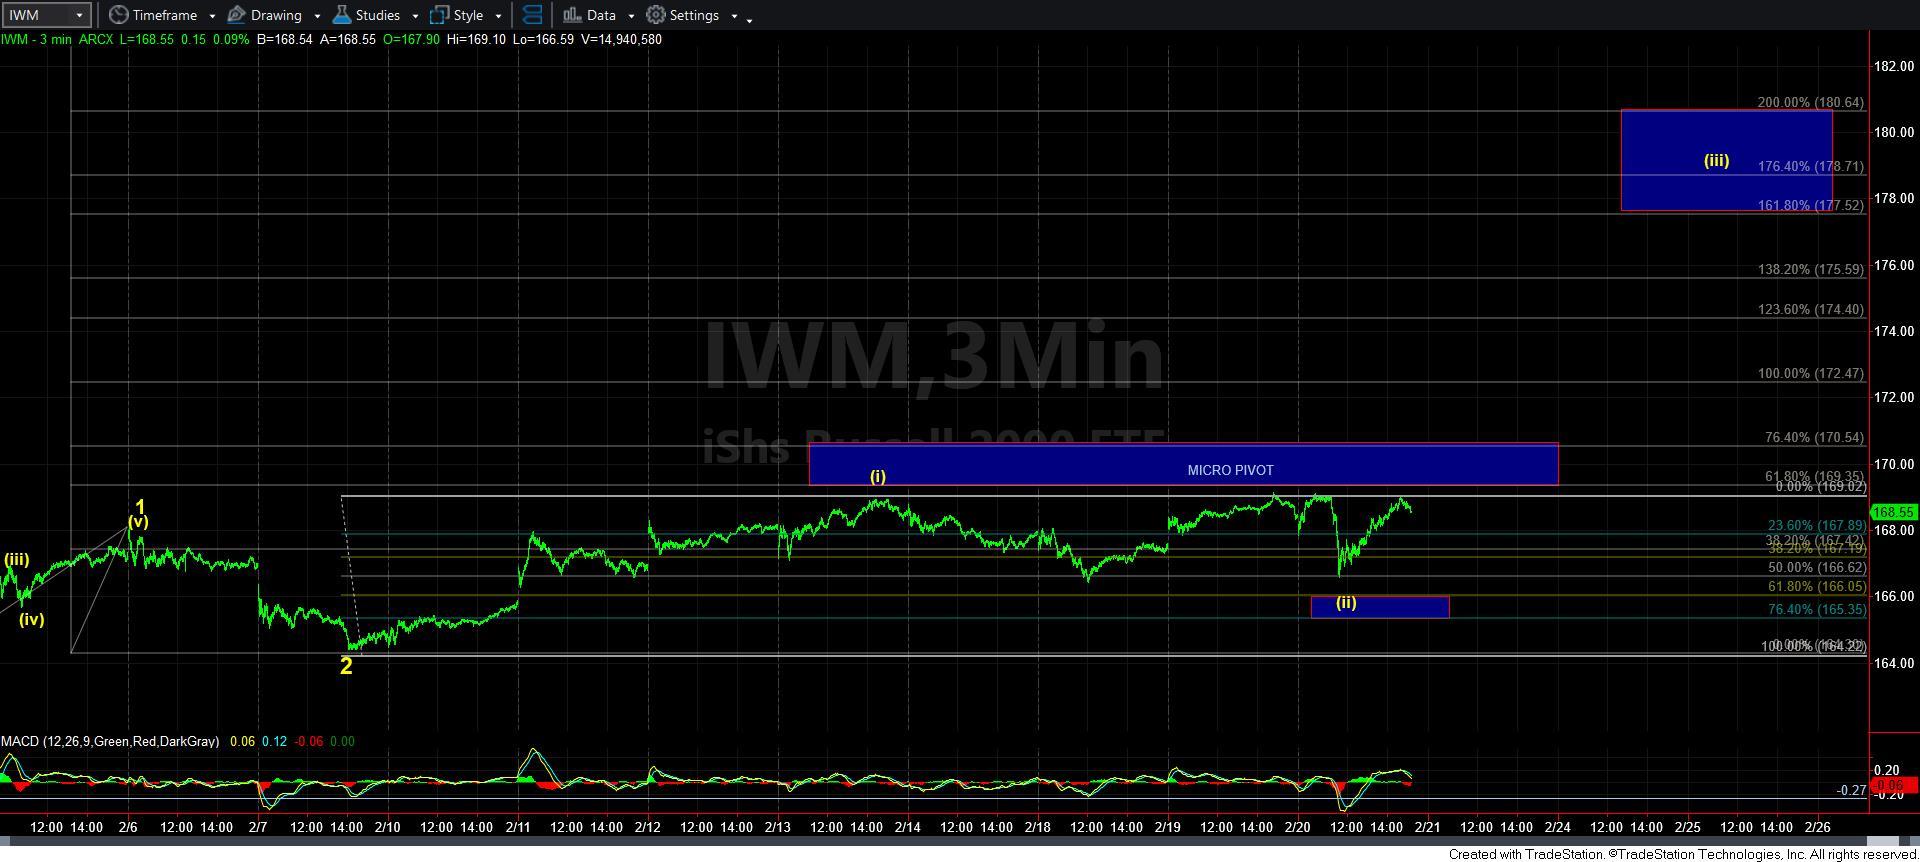
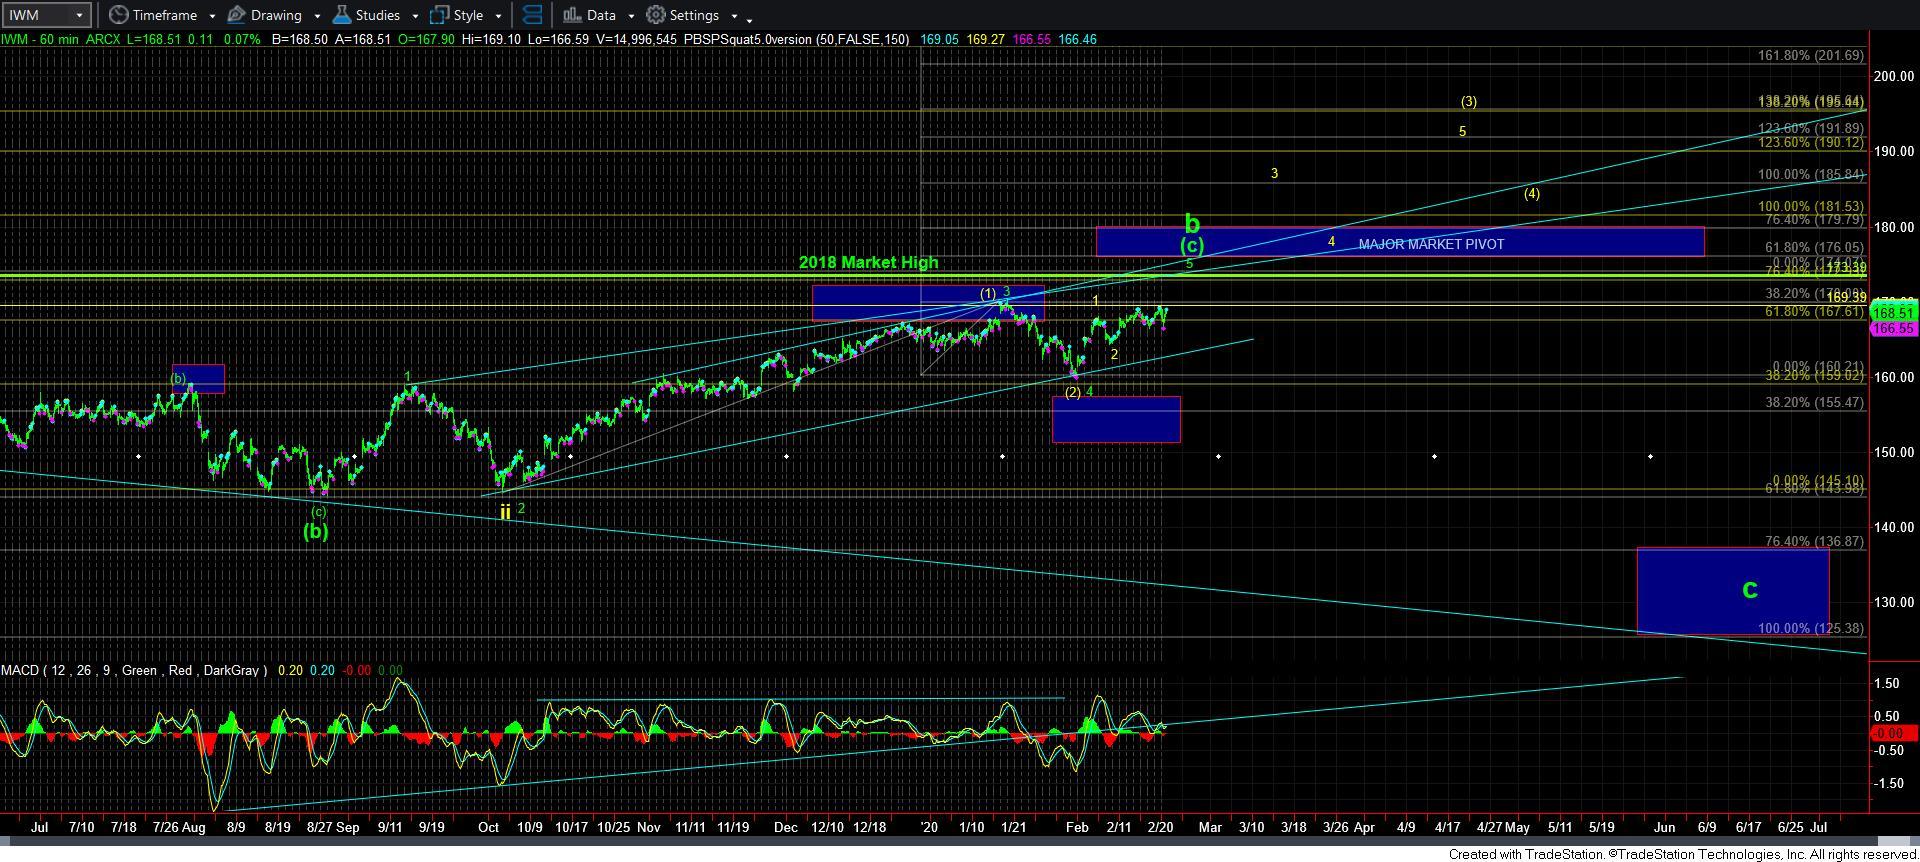
In the meantime, I want to highlight that the IWM has given us hints of outperformance with today’s action. While the SPX was still well in the red, the IWM actually went green today, and came right back to test the micro pivot presented on the 3-minute chart from below. Remember, once we break out over that pivot, we will likely test the 173 region, which will then make the 169 region (the bottom of the pivot) our support. As long as the IWM holds over that support once we get to 173, then we are likely heading up to 177+, and rather quickly. However, if we fail to hold 169 after striking 173, then the b-wave top was likely struck, and the market will be seeing some serious weakness over the coming months, as the IWM drops down to its c-wave target below, as seen on the 60-minute IWM chart. So, our big test is still likely setting up over the coming weeks.
For now, my preference remains to see another drop down towards our target box for wave 2, which is still my primary count for as long as we remain over 3280SPX. And, once the market breaks out over 3400SPX, then we are on our way to test the 3480SPX region, likely at the same time that the IWM sees its test of the 173 region.